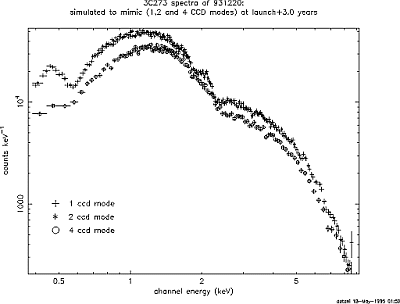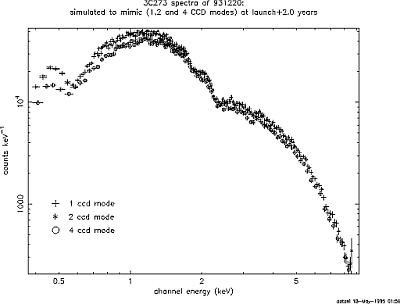


Simulated spectra of 3c273 (in December 1993) in various clocking modes at two different epochs. The first panel shows the spectra expected at 2 years after the launch, and the second panel those of 4 years after the launch. These histograms are of actual flight faint mode (3 x 3) data. Expected RDD effects were introduced by Monte Carlo corruption of all pixels, such that the corner pixel distributions are consistent with current, best projections (by Yamashita and Dotani) of the RDD evolution. Naturally, this includes the RDD-driven, self-consistent onboard zero level error. Onboard processing of this data was also simulated to produce these histograms.