Characteristics of the GIS particle Background (February 10, 1996)
This document is obsolete and kept for archive purpose. A newer page on the same topic, GIS Background and Data Selection Criteria, supersedes this document.
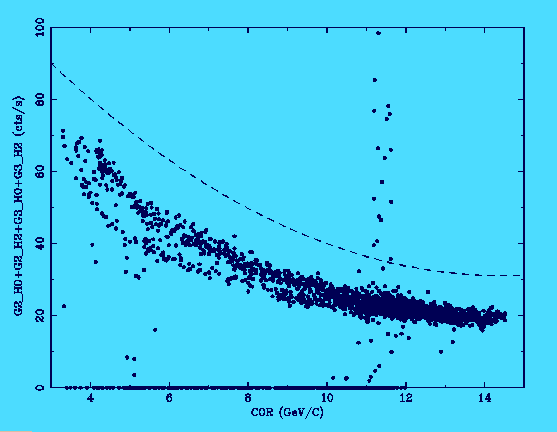
The GIS team reported at the ASCA calibration meeting in December 1995 that they found the GIS particle background shows flare-like events from time to time. These flare-like events are classified into 'hard-flares' and 'soft-flares' according to those energies. The hard-flare events are clearly manifested in the H0 and H2 monitor counts such that H0+H2 conspicuously increases when magnetic cut-of-rigidity (COR) is around 11 to 12, as shown in the diagram below.

Hence, by taking the region only below the broken line (G2_H0+G2_H2+G3_H0+G3_H2 < 0.45 * COR**2 -13 COR +125), most hard-flare events can be rejected.
The soft-flare events, which still remain after rejecting the hard-flare events, do not appear in the H0+H2 monitor counts clearly. Hence it is more difficult to reject the soft-flare events. It was found that the soft-flare events tend to be strong near South Atlantic Anomaly and Hawaii Anomaly, in particular when the satellite altitude is 580 - 600 km. This suggests that the soft-flare events may be rejected effectively using satellite orbital parameters, and a practical formulae of the data selection is now being investigated.
We will soon incorporate new data selection criteria in the ascascreen to reject the hard and soft-flare events effectively.
If you have any questions concerning ASCA, visit our Feedback form.

