The Degradation of SIS1 relative to SIS0
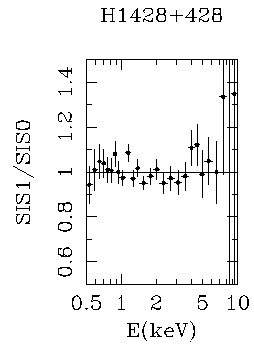
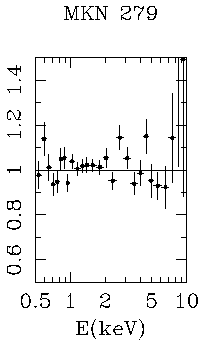
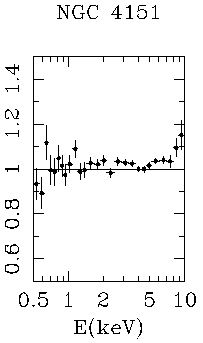
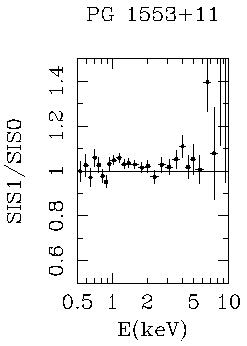
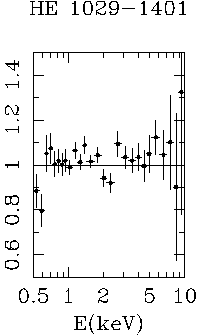
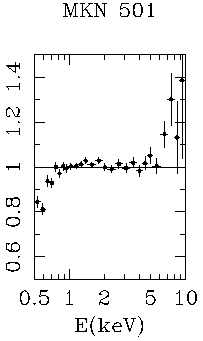
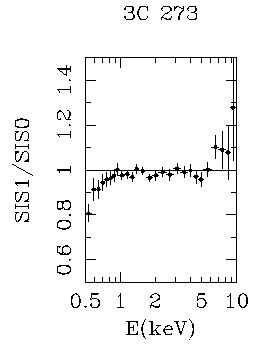
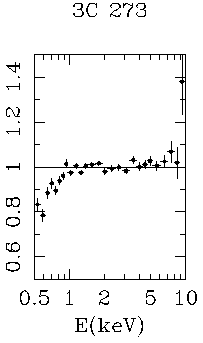
The ratios of SIS-1 spectra to SIS-0 spectra for some representative bright sources during the period 1994-2000 are shown below.
 |
 |
 |
 |
 |
 |
 |
 |
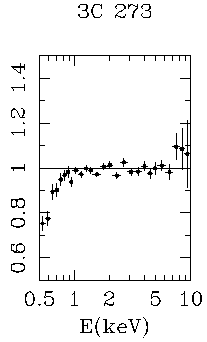 |
Background has been subtracted and the spectra have been corrected for the telescope response. It can be seen that in the earlier spectra the SIS-1/SIS-0 ratio is consistent with unity over the entire energy band (apart from a few cases in which the SIS-1 data above ~7 keV are higher than SIS-0, an effect thought to be due to inaccuracy in the telescope calibration). Spectra taken later in time show a larger SIS-1/SIS-0 discrepancy. An important question is whether time is the only parameter which determines this discrepancy. If the SIS-1/SIS-0 ratio turns out not to be strictly related to time then the absolute discrepancy cannot be strictly related to time either.
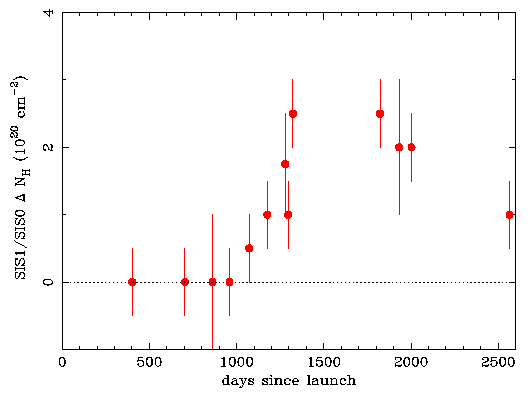
Figures 3a, 3b and 3c below show that the low-energy degradation is NOT strictly monotonic with time. Figure 3a shows the SIS-1/SIS-0 ratios for four observations of four different sources over the period 1996/day 180 to 1998/day 107. It can be seen that there is no clear trend of the SIS-1/SIS-0 discrepancy with time, and if anything, the discrepancy in NGC 5548 (1996/days 180-187) appears to be LARGER than that in 3C 273 (1996/day 201), which is opposite to the overall long-term trend. In fact, for the sources in Figure 2 we have parameterized the low-energy SIS-1/SIS-0 ratio as an effective absorbing column, using simple "eye-ball" fits and this effective excess column is shown below in Figure 3b. The overall trend is an SIS-1/SIS-0 ratio that is near unity up to about the begining of 1996 but then rises rapidly over the next year and then levels off and is possibly decreasing by the end of 1999. Superimposed upon the overall trend one can see local departures from the overall trend and in the opposite sense. This non-monotonic behavior CANNOT be due to a difference in the source spectra, as can be seen in Figure 3c which shows the SIS-1/SIS-0 ratios for four observations spanning four years, over the period 1995/day 362 to 2000/day 10. One observation is of NGC 4636 and the other three are of 3C 273. The latter source shows little spectral variability in these observations and the 3C 273 spectra are very different from the spectrum of NGC 4636. Yet all four of the SIS-1/SIS-0 ratios are fairly similar. Note that the ratios below 0.6 keV are more sensitive to any background subtraction systematics than at higher energies.
 |
 |
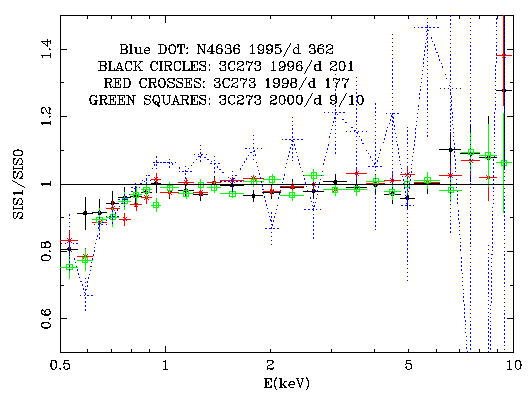
with time is not due to different source spectra
Previous: Strategy
Next: Absolute Mode-Independent Calibration Points
Back: "SIS Low-Energy Degradation" Main Page
This file was last modified on Monday, 30-Jul-2001 18:17:25 EDT
Curator:
HEASARC Guest Observer Facility
If you have any questions concerning ASCA, visit our Feedback form.

