NICER / ISS Science Nugget
for January 7, 2021
The Burning Atmosphere
The extreme gravitational pull of a neutron star is strong enough that it can induce thermonuclear fusion of light elements (typically hydrogen and helium, and sometimes carbon) in the stellar atmosphere. Once triggered, this fusion process is highly unstable - in a matter of seconds, the thermonuclear flame wraps around the star, burning all available fuel as it goes. This explosion causes the neutron star to light up brightly in what is called an X-ray burst.
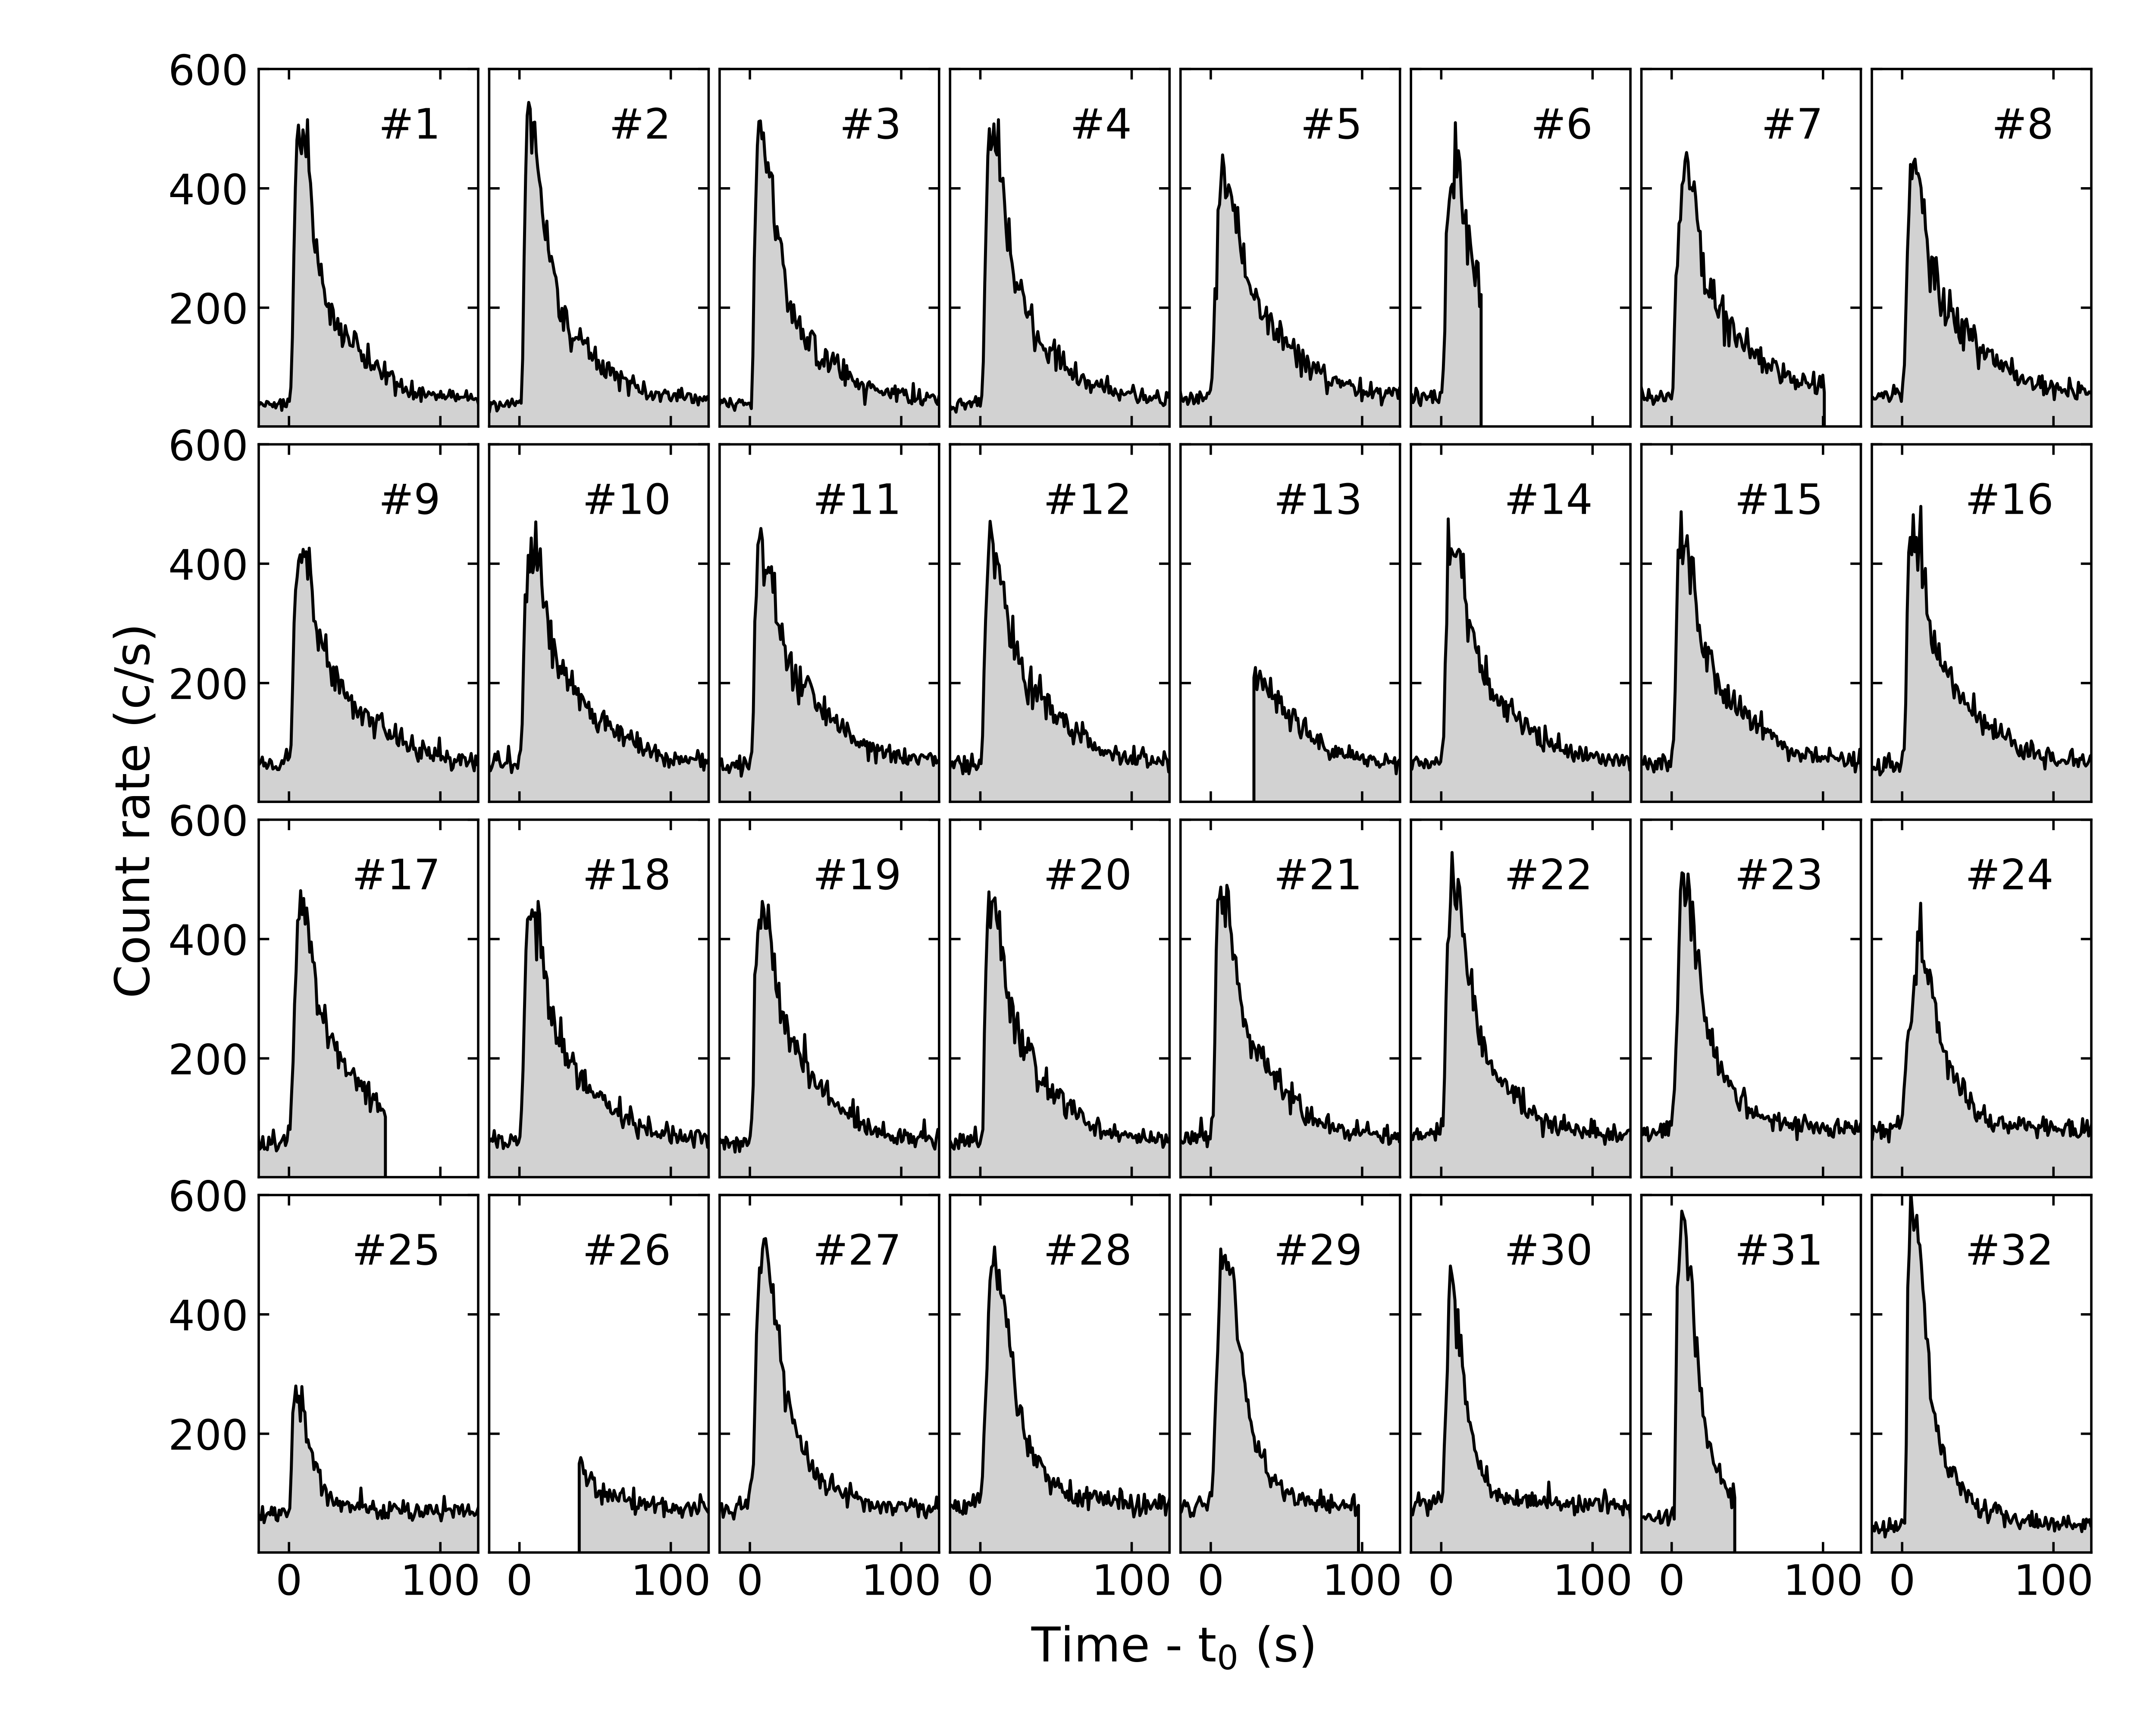
In early February of 2020, the known neutron star system XTE J1739-285 became visible in X-rays to NICER - a sign that matter was accreting onto the stellar surface. By the 20th of February, enough matter had accumulated on the star to trigger an X-ray burst. It then only took a few hours for the ongoing accretion to restore the stellar atmosphere, and the next burst occurred. This was the start of a prolific bursting state: over the course of 20 days, NICER observed 32 X-ray bursts. Accounting for the fact that NICER only looked at the source for a few hours every day, we estimate that some 250 X-ray bursts must have occurred in total.
In a recently accepted peer-reviewed paper, Dr. Peter Bult (NASA GSFC & Univ. of Maryland) and collaborators present a comprehensive analysis of this sample of X-ray bursts, and with it the most detailed investigation of XTE J1739-285 to date. Among other results, they show that the bursts are highly homogeneous in their nuclear composition, and suggestive of a binary system observed at a high inclination (i.e., the orbit is nearly edge-on as viewed from Earth). Additionally, the team finds evidence for a 2.6 ms brightness oscillation in one of the X-ray bursts, which is suspected to reflect the neutron star's rotation rate (approximately 380 revolutions per second). While this conclusion will need to be confirmed with future measurements, it demonstrates that XTE J1739-285 is exceedingly unlikely to have a sub-millisecond rotation period, as had been claimed in 2007.

Figure: A gallery of the "light curves" - X-ray brightness as a function of time - of each X-ray burst from XTE J1739-285 observed with NICER during February and March 2020. The light curves are plotted at 1-sec time resolution relative to t0, the start time of each burst, and cover the 0.5-10 keV photon energy band.
<< Previous
Main Index
Next >>