NICER / ISS Science Nugget
for December 30, 2021
A new X-ray phenomenon revealed in a magnetar through near-daily NICER observations
Magnetars, isolated neutron stars with the largest magnetic fields measured in the universe, randomly go through episodes of elevated X-ray emission that last anywhere from months to years, i.e. magnetar outbursts, during which extreme spectral and temporal variability is observed. Prior to the launch of NICER, several magnetars have exhibited a complex pulsed X-ray light curve (the X-ray emission as a function of the star rotation) at the onset of their outbursts in the form of several peaks, only to show a more simplified form months later. Yet, this evolution was never resolved; an essential element that would inform the physics behind the observed properties of magnetar outbursts.
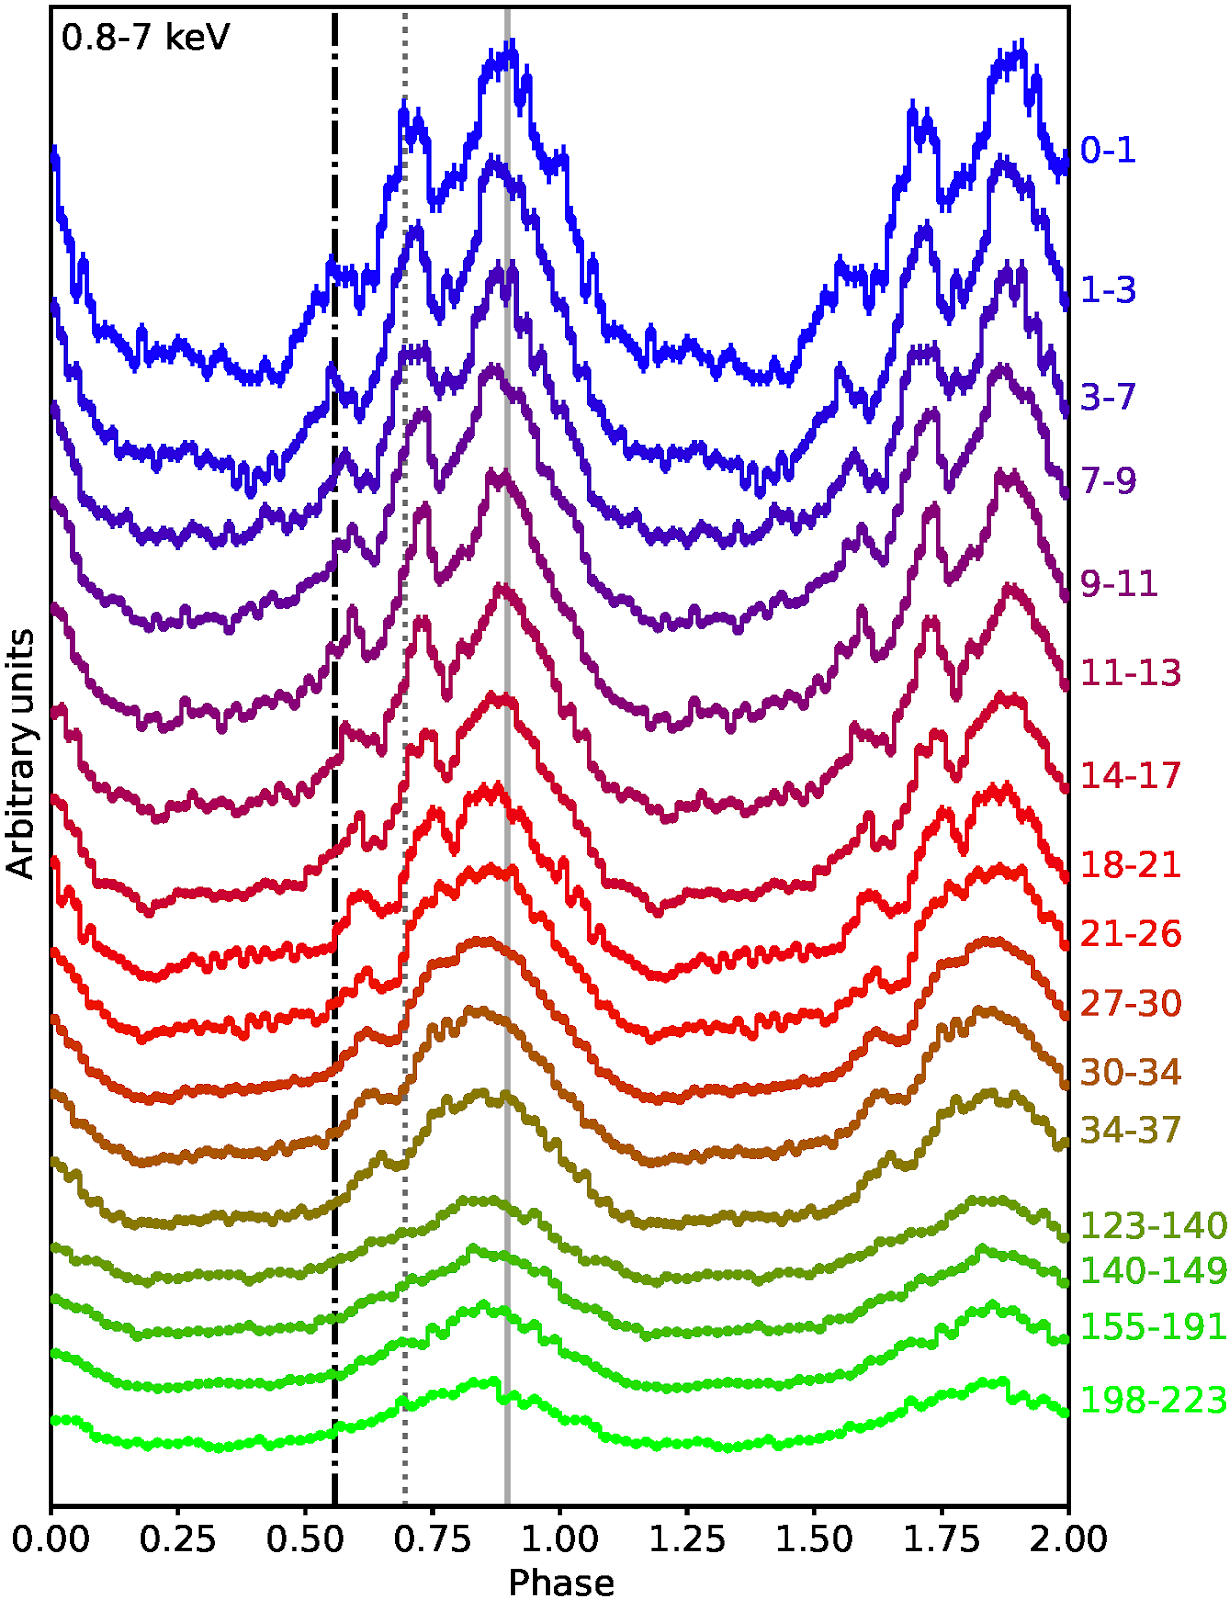
After the Swift BAT discovery of the magnetar SGR 1830-0645 on 2020 October 10, NICER initiated a series of near-daily observations of the source covering the first 37 days of the outburst. The magnetar's soft X-ray pulse profile just six hours after its discovery exhibits a complex shape, clearly displaying three separate peaks (figure). Detailed phase-resolved spectroscopic analysis of these soft X-rays recorded with NICER established the thermal nature of these peaks, and pointed to surface hot spots for the emitting region. As the observations accumulated, a shift in the peaks was clearly observed, in the direction to simplify the pulse to a near-sinusoidal form, about 37 days later. This is the first time that this phenomenon has been observed during a magnetar outburst, at last resolving the manner in which magnetar pulse profiles evolve. Decomposing each of the pulses in the figure into its waveforms, we can derive an upper-limit of ~100 meters per day for the speed of the peak motion. These measurements directly connect to the neutron star crust properties within which the motion is occurring, enabling a close-look at this poorly known entity in neutron stars. These results and their implications will appear soon in a peer-reviewed publication by G. Younes & collaborators in the Astrophysical Journal Letters.

Figure: Soft X-ray pulse profiles of SGR 1830-0645 throughout the outburst as derived with NICER (numbers to the right of Figure are days from outburst onset). Two rotational cycles are shown for clarity. The dash-dotted, dotted, and solid vertical lines are the centroids of the peaks as derived during the first day of NICER observations. Just by eye, one can clearly discern a shift in pulse peaks in the direction to simplify the profile into a sinusoidal form. This phenomenon has not been observed in any magnetar before.
<< Previous
Main Index
Next >>