NICER / ISS Science Nugget
for September 5, 2024
A magnetar bursting into prominence
Matter in its most extreme form can be found in neutron stars, where up to 2 Solar masses of material is crushed into a sphere 12 km in radius, resulting in the densest objects in the universe. Neutron stars come in different flavors, distinguished primarily by the phenomena powering their emissions. Those endowed with the highest rotation speeds, exceeding 700 revolutions per second, have rotational kinetic energy to spare. In contrast, some neutron stars are "slow" rotators, completing one rotation in a meager handful of seconds, yet some of these slow rotators possess super-strong magnetic ("B") fields at the level of 1011 Tesla (1015 Gauss, where the Earth's magnetic field is approximately 1 Gauss), making them the strongest magnets in the universe. These neutron stars are dubbed magnetars. Such large B-fields generate stresses on the star's solid crust. If enough stress builds up in a localized volume, exceeding the crustal yield strength, the crust can crack and the newly deposited magnetic energy is released through a large amount of X- and gamma-ray radiation, in a matter of milliseconds. Such events are called magnetar short bursts; they signal the "failure" of a crustal patch under magnetic stresses and the start of an "active" state, or outburst. In these days-to-months-long states, X-ray observatories can probe the site of the crustal failure, and how it heals as the deposited energy is dissipated.
On August 20, 2024, at 19:01:18 UT, the Burst Alert Telescope (BAT) onboard NASA's Swift observatory recorded a short magnetar-like burst from the vicinity of the known magnetar 1E 1841-045. A few additional detections followed, with BAT and the Gamma-ray Burst Monitor (GBM) instrument onboard NASA's Fermi telescope. Approximately four hours after the first BAT detection, NICER began its first triggered observation and saw several short bursts, confirming the magnetar's active state, eight years after its last known activation. NICER monitoring through August 31 enabled a comparison of the magnetar's pre-outburst and current emission properties, with results reported via Astronomer's Telegrams #16789 by M. Ng (MIT) and #16802 by G. Younes (Univ. of Maryland Baltimore County/NASA GSFC) and their collaborators. These reports prompted followup, and coordinated, observations,with NASA's NuSTAR high-energy X-ray telescope as well as with multiple ground-based radio telescopes, such as the MeerKAT facility in South Africa.
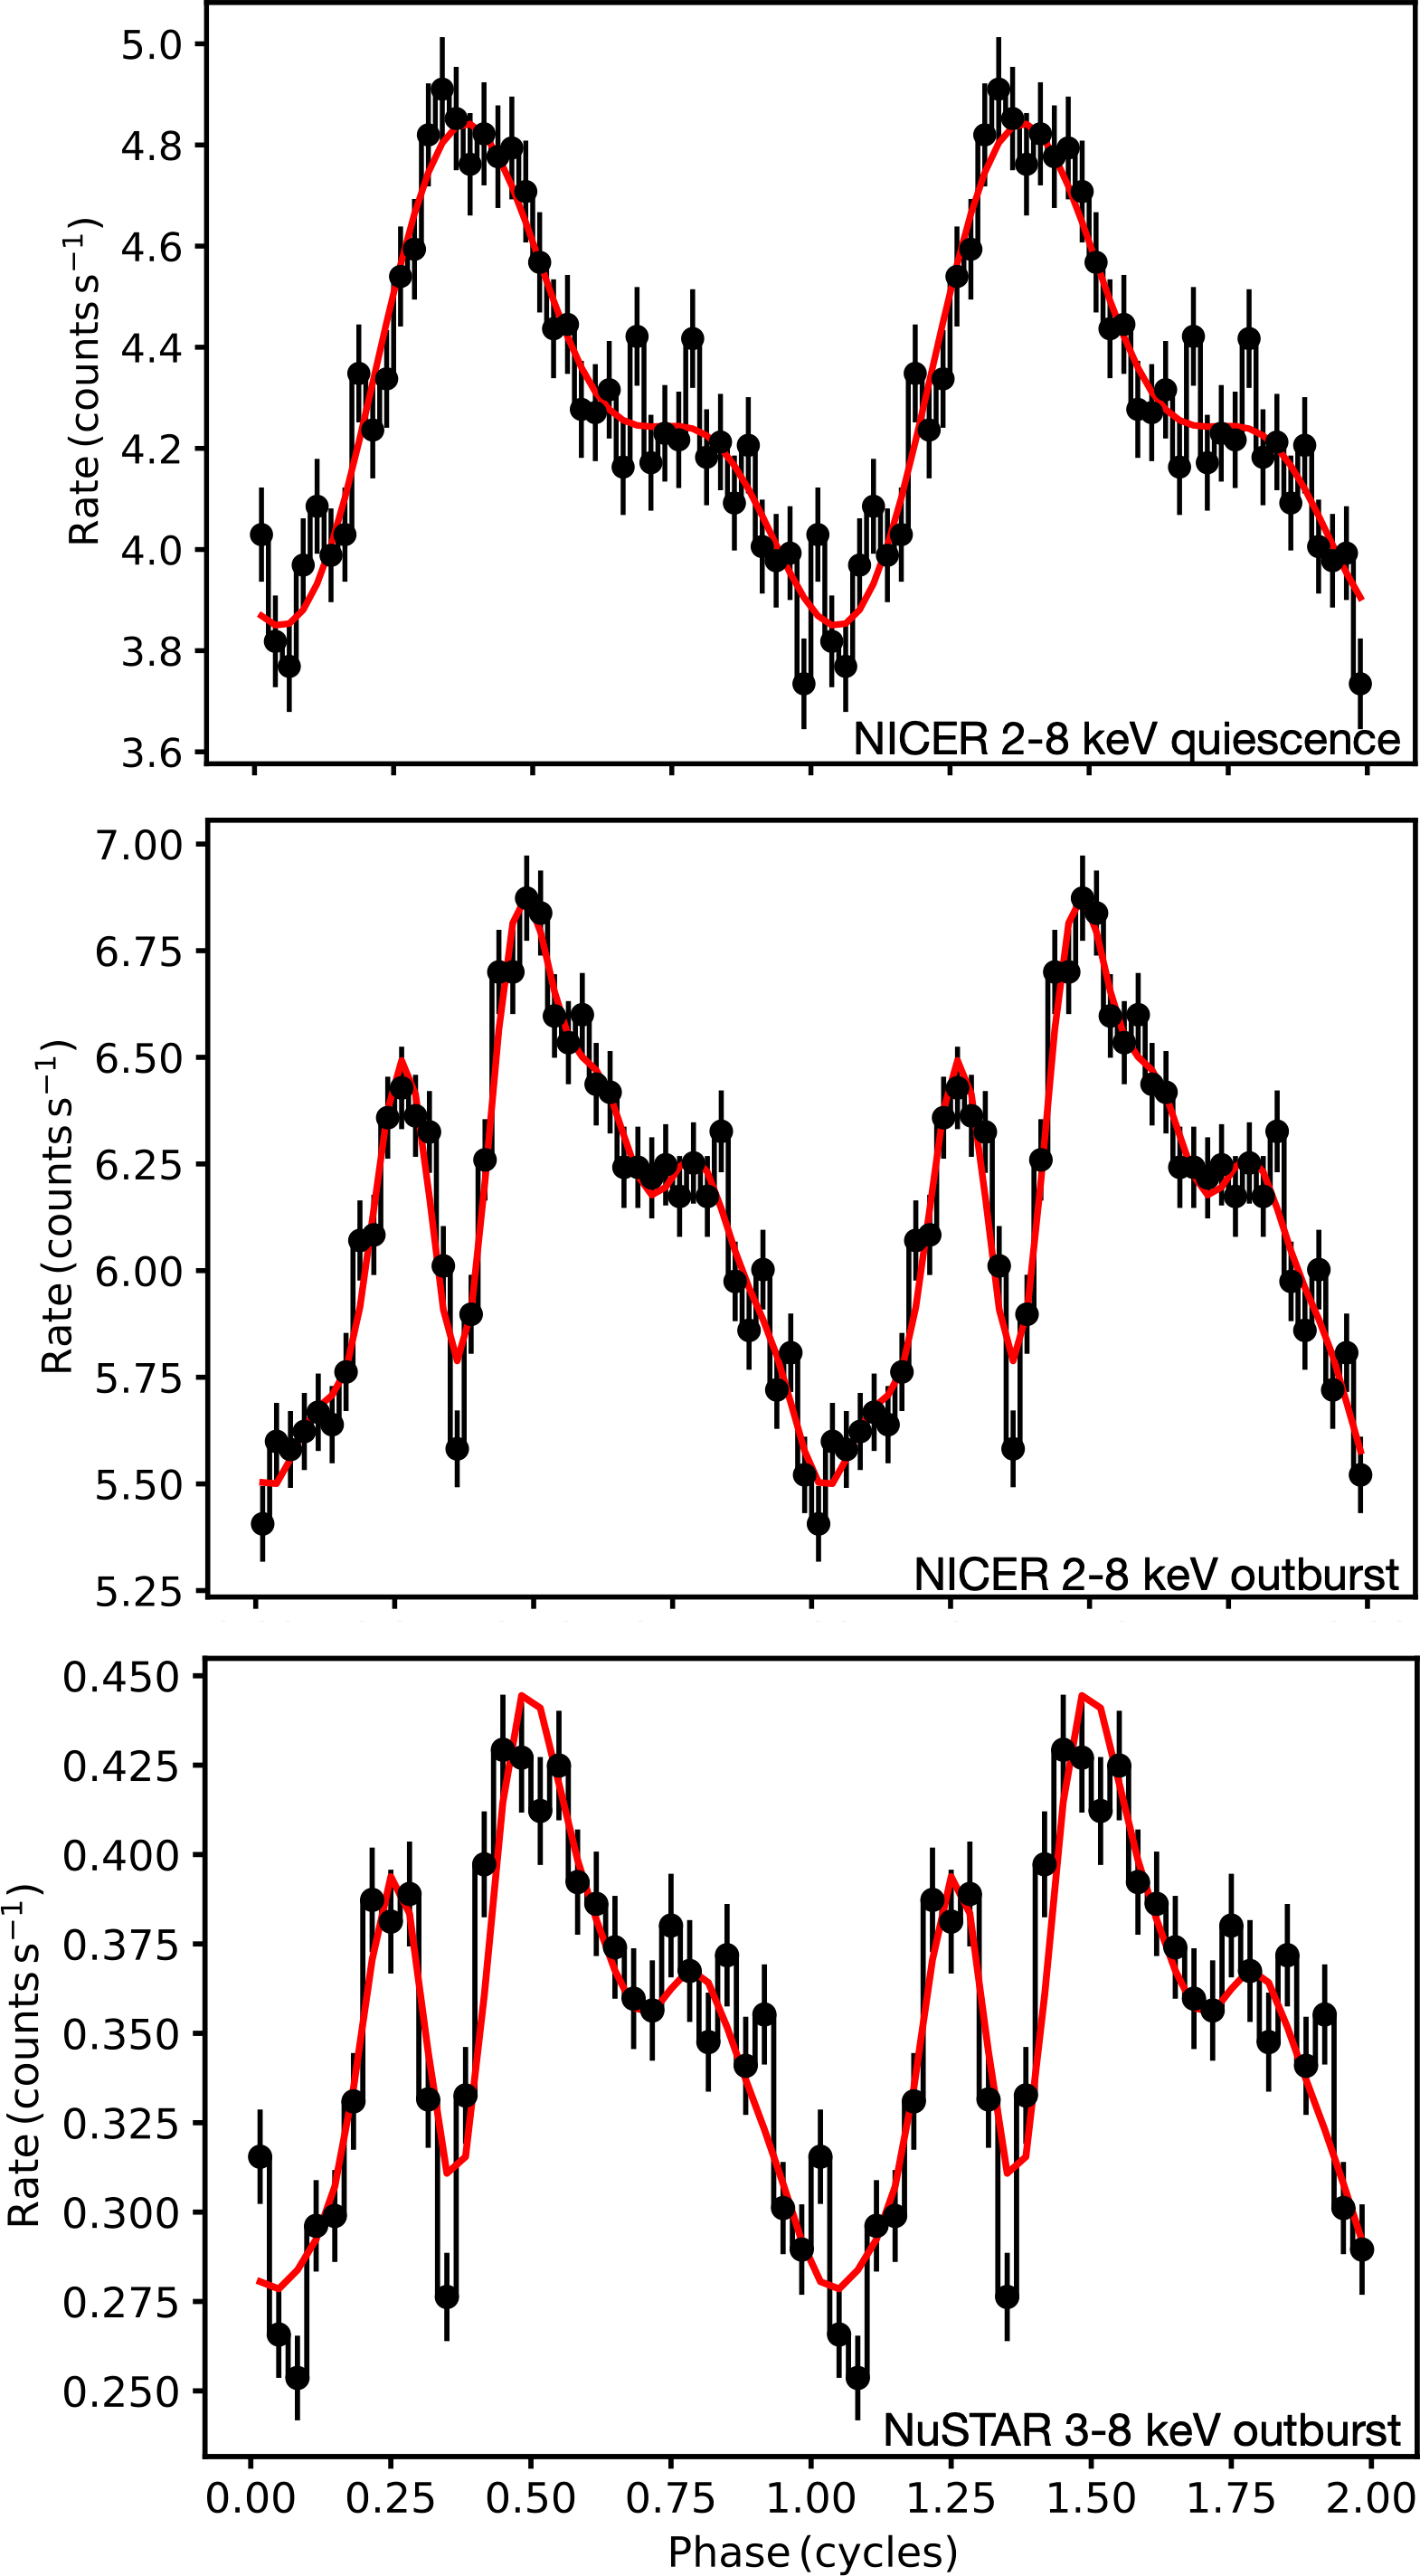
1E 1841 typically shows broad double-peaked X-ray pulsations at a spin period of 11.8 seconds. NICER and concurrent NuSTAR data show substantially different pulse shapes before and during the outburst - now a complex multi-peaked profile. This signals the appearance of new hot spots on the neutron star's surface, likely at the site of the crustal failure where magnetic energy has been deposited. Continued monitoring with NICER and other telescopes will reveal the spectral and temporal evolution of these hot spots, informing our incomplete understanding of the physics of neutron star crusts, magnetic-field evolution, and radiation transport in high-field regimes unattainable in Earth-bound laboratories.


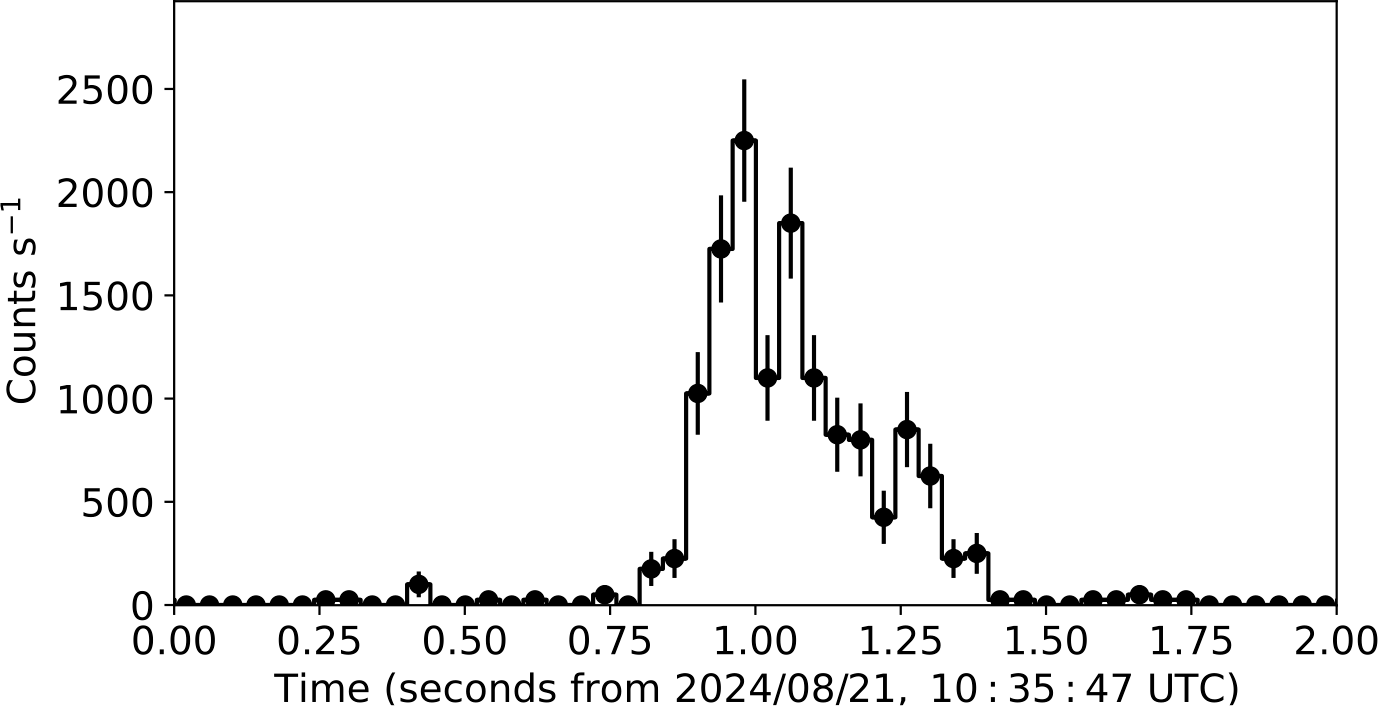
Left: A short-duration burst, captured by NICER in the 1.5-9 keV photon energy band, from the magnetar 1E 1841-045, currently active for the first time since 2016 (prior to NICER's launch). Individual photon detections are grouped into bins 40 milliseconds wide, revealing structure on similar timescales. Such bursts can appear in isolation or in "forests" containing large numbers of them. (Credit: G. Younes)
Right: The 11.8-second rotation rate of the 1E 1841 neutron star produces X-ray pulsations. Measurements (black points with error bars) made by NICER in the magnetar's quiescent state, through an every-other-week monitoring campaign in place before the current outburst, are shown in the top-panel. The middle panel reveals changes to the emission pattern during the outburst; these are confirmed (bottom panel) by NuSTAR data in the overlapping parts of their photon energy coverage. Two cycles of identical data are plotted for clarity, and red traces show representations of the waveforms derived by harmonic decomposition. (Credit: G. Younes)
<< Previous
Main Index
Next >>