The High Pressure Gas Scintillation Proportional Counter
on-board the BeppoSAX X-ray Astronomy Satellite
G. Manzo, S.Giarrusso, A. Santangelo, F. Ciralli, G. Fazio,
S. Piraino, and A. Segreto
CNR - Istituto di Fisica Cosmica ed Applicazioni dell'Informatica,
Via Mariano Stabile 172, 90139 Palermo,Italy
Abstract
In this paper we describe the High Pressure Gas Scintillation
Proportion Counter, one of the Narrow Field Instrument of the X-ray
astronomy satellite BeppoSAX. Sensitive in the 4-120 keV band, the
HPGSPC will study all astrophysical sources emitting in the poorly
studied hard X-ray band. The design and performances of the instrument
are reported together with results of the on-ground calibration data
analysis.
Key words: Instrumentation: detectors - X-ray: general
1. Introduction
The Italian Dutch Satellite for X-ray Astronomy SAX, Satellite
Astronomia X (Scarsi 1993), renamed BeppoSAX in honour of Giuseppe
Occhialini, has been carried into a low-Earth orbit (height of 600 km
and inclination /= 4o ) by an Atlas
Centaurus Rocket on April 30, 1996. The BeppoSAX payload consists of
four Narrow Field Instruments (NFIs) coaligned along the Z axis of the
spacecraft and two Wide Field Cameras (WFCs, Jager et al. 1995) which
point along the +y and -y axis respectively. The NFIs package includes
an imaging Low Energy Concentrator System (LECS, Martin et al. 1995),
three units of the imaging Medium Energy Concentrator System (MECS,
Boella et al. 1995), the High Pressure Gas Scintillation Proportional
Counter (HPGSPC, Giarrusso et al. 1995) and the Phoswhich Detector
System (PDS, Frontera et al. 1995). Using the NFIs BeppoSAX will be
able to perform detailed spectroscopic and timing studies of more than
2000 celestial X-ray sources with an unprecedented wide energy band
that ranges from a fraction of keV (0.1 keV is the lower limit of the
LECS) up to 300 keV (the upper limit of the PDS). More details on the
mission and its scientific objectives can be found in Scarsi 1993 and
Piro et al. 1995. Send offprint requests to: A. Santangelo:
andreas@ifcaii.pa.cnr.it
Observation of cyclotron features, that are present in the X-ray
spectrum of many celestial sources is the primary scientific goal of
the HPGSPC. Cyclotron features provide a powerful means of
understanding the physics of radiative transport in highly magnetic
plasmas. We note that Ginga observations (Makishima et al. 1991) of
cyclotron lines in several accreting X-ray pulsars have confirmed and
enlarged previous positive detections by other experiments in Her X-1
(Tršumper et al. 1978) and X0115+634 (Wheaton et al. 1979), and
have provided a great impetus for attempts at modelling the emission
region of these objects. With the HPGSPC and PDS, BeppoSAX will be
able to address open crucial points such as the presence and nature of
multiple harmonics and the shape and energy of lines. Sensitive in the
4-120 keV energy band the HPGSPC will, also, complement the source
continuum observation of concentrators/spectrometers and the PDS and
the iron line studies of concentrators/spectrometers. In the
anticipated 4 year lifetime of the mission the HPGSPC will study the
hard band of the spectrum of many astrophysical objects such as the
Seyfert 2 galaxies, some of which have been already detected by OSSE
and/or BATSE in the hard X-ray band (Johnson et al. 1994), and Seyfert
1 galaxies (to study the high energy bump above 10 keV and the
presence of the break above about 50 keV). In addition the HPGSPC will
address the problem of the hard tails in the spectrum of black hole
candidates.
Funded by the Italian Space Agency (ASI), the HPGSPC was invented and
designed by the Istituto di Fisica Cosmica ed Applicazioni
dell'Informatica (IFCAI, Palermo) of the Consiglio Nazionale delle
Ricerche and has been developed by Laben, Milan and Alenia Spazio,
Turin, under the scientific responsibility of IFCAI and ASI.
Both the Flight Model and the Spare Flight Unit have
been successfully integrated, tested and calibrated at the
Laben premises respectively during October/November
1994 and July/August 1995.
2. Instrument description
The HPGSPC instrument is a High Pressure Gas Scintillation
Proportional Counter filled with a high purity gas mixture of Xenon
(90%) and Helium (10%) at 5 atmospheres.
The basic mechanism of Gas Scintillation Proportional Counters is
quite well known and has been extensively described by different
authors (Gedanken et al. 1972, Manzo et al. 1980).
After penetrating the beryllium window, the X-ray photon is absorbed
in the gas cell by a Xenon atom via the photoelectric effect. The
primary photoelectron emitted gives rise to a localised cloud of
secondary electrons at the position of X-ray absorption. The secondary
electron cloud, driven by a relatively moderate electric field, after
drifting in the so called Drift Region, enters a high field region
(Scintillation Region) in which the electrons acquire sufficient
energy to excite the Xenon atoms. As a result of collisions, the
excited atoms form excited diatomic Xenon molecules which then
deexcite by the emission of VUV photons in the 1500-1950 angstrom
range. Typical duration of scintillation, measured as the time
interval between the 10% and 90% of the signal, is 3.5
-6sec and does not depend on the energy. In the case of the
HPGSPC VUV light is collected by an array of seven photomultipliers in
an Anger Camera configuration. The number of electrons emitted per keV
by the cathode of central photomultiplier is about 250.
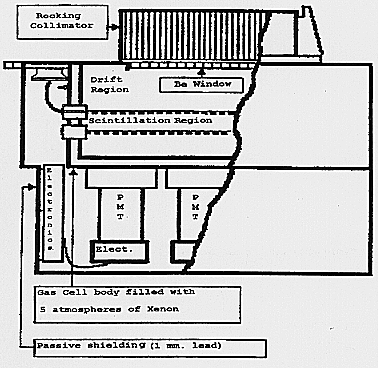 Fig. 1. Schematic view of the Flight model of the HPGSPC.
A schematic view of the main components of the Flight
Model of the HPGSPC is shown in Fig. 1. Table 1 summarises
the main characteristics. The HPGSPC instrument consists,
primarily, of a Detector Unit (DU) and an
Electronic Unit (EU).
2.1. Detector Unit
Table 1. HPGSPC overall characteristics
| Parameter | value
|
|---|
| Exposed geometrical area | 450 cm 2
|
| Body of cell | titanium 3 mm thick
|
| Depth of Drift Region | 10 cm
|
| Depth of Scintillation Region | 1 cm
|
| Depth of Back Region | 6.3 cm
|
| Suprasil UV Exit Window | 8.4 cm diam, 5 mm thick
|
| Suprasil UV read-out | 8.1 cm diam
|
| Drift Region Voltage | 8 kVolt
|
| Scintillation Region Voltage | 20 kVolt
|
| Filling Gas | 90% Xe + 10% He
|
| Filling Pressure | 5 atm
|
| Outer Diameter | 42.5 cm
|
| Useful Diameter | 24 cm
|
The construction of the sealed cylindrical gas cell, whose cross
section is shown in Fig. 2, was carried out by AEG, Ulm, following
Ultra High Vacuum standards. This is imposed by the requirements on
leak tightness (10 mm) covered with an entrance window (30 cm
diameter) made of beryllium. The beryllium window, shown in Fig. 3,
was one of the most technically challenging parts of the
instrument. The design must meet two contradictory requirements:
transparency to X-rays down to 3 keV and the mechanical stiffness
required to withstand the 5 atmospheres differential pressure on a
diameter of 30 cm. The window is made of two beryllium foils, 0.5 and
0.8 mm thick supported by an egg crate structure of orthogonal
beryllium ribs. The core self supporting structure is welded to the
titanium body via an aluminium/titanium transition ring aimed at
compensating for mechanical stresses generated during the bake-out at
300o degrees.
An absorption region (Drift Region) of 10 cm and a scintillation gap
(Scintillation Region) of 1 cm are defined by two circular mesh grids
with a diameter of 300 mm, made with orthogonal titanium wires with a
spacing of 3 mm and a diameter of 150 -6m. To maintain the
uniformity of the electric field in the Drift Region five field
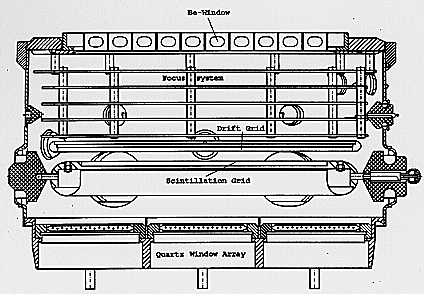 Fig. 2. Gas cell cross section.
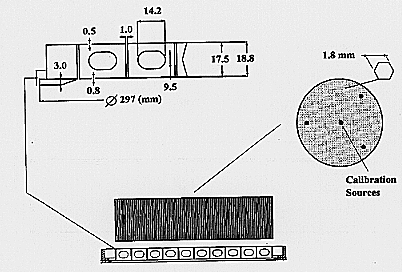 Fig. 3. Collimator and window.
shaping rings made of NCR alloy are placed every 16.0 mm. The two mesh
grids can be set up to a nominal value of 10 and 25 kVolt. In the
Flight Model, however, because of microdischarge occurring in a
localised point in one of the high voltage feedthroughs, the reduced
field applied in the Scintillation Region was only 2 kVolt/cm/atm with
a reduction of VUV light production. Due to the high electrical field,
the two grids are terminated by guard electrodes whose shape is
critical in terms of higher field values generated. Each of the two
grids is held in place by six ceramic insulators which are welded to
the outer wall of the cell. For each grid one of the insulators is
also used as a high voltage feedthrough. The high voltage applied, the
constraints on the dimension and shape, the breakdown field strength
of the gas have made the design of the grids rather critical. In the
end, a compromise between the best theoretical (Rogovsky profile) and
the most feasible shape has been used. This is a circular profile with
a variable radius.
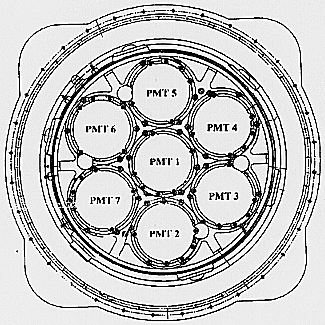 Fig. 4. The PMTs in an Anger camera configuration: the central PMT
is surrounded by six lateral PMTs.
At the bottom of the detector seven ruggidized EMI D319Q
photomultipliers (PMTs) in an Anger camera configuration, as in
Fig. 4, detect the VUV light produced in the Scintillation Region. As
an interface between the PMTs and the pressurized gas cell a titanium
flange, welded to the titanium body, supports seven suprasil 1 quartz
windows each 5 mm thick. The 6.3 cm between the scintillation grid and
the quartz windows define the so called ''Back Region''. On top of the
detector a 10 cm high collimator (manufactured by Officine Galileo,
Florence) limits the field of view to 1o x1o
degree FWHM. The collimator consists of hexagonal cells made with 50
-6m of aluminium plated with 10+10 -6m of
lead. Four highly collimated calibration sources are mounted in the
collimator in the position shown in Fig. 3. Each calibration source
consists of a mixture of Fe 55 and Cd 109 radioactive sources, with
calibration lines at 6, 22, 25 and 88 keV. The sources are used for a
continuous monitoring of the gain and for a real time equalization of
the relative gain of the photomultipliers performed by the Automatic
Gain Control (AGC) chain. To reduce the residual background, the
Detector Unit is shielded with 1 mm of lead and 2 mm of tin around the
sides and bottom.
2.2. The electronics
The HPGSPC High Voltage supplies, the Front End Electronic (FEE), the
Electronic Unit and the data conditioning system have been designed
and produced by Laben, Milan.
The seven signals coming out from the PMTs are slightly preamplified,
shaped and then transmitted, via a Current Loop transmitter, from the
FEE to the Electronic Unit that constitutes the main electronic part
of the Instrument. The Electronic Unit interfaces the Detector Unit to
the On Board Data Handling (OBDH) bus. In the EU, the PMT signals
received from the DU are processed, A/D converted and finally
formatted for transmission to the OBDH. In addition, Housekeeping
signals (High Voltage monitoring and temperature monitoring) are
converted and formatted, jointly with other Digital Housekeeping, for
transmission to the OBDH.
The signals coming out from the DU are slightly delayed (this is
needed to allow the event qualification board to send the
''integrate'' signal if the current pulse exceeds a programmable
threshold) and then integrated by seven gated integrators each with 8
-6sec integration time constant. A Sum signal is then
obtained with an analogue sum of the seven integrated signals. The
pulse duration is also measured by the burst length chain that
measures the interval time between the 20% and the 80% of the
integrated sum signal. As shown below, information on burst length is
used to discriminate genuine X-rays against background events or
anomalous events such as those absorbed in the Scintillation Region
and/or Back Region.
Event qualification and processing is performed both by the Analogue
Processor and the Digital Processor. While analysis of energy and of
pulses shape along with burst length qualification and A/D conversion
is performed by the Analogue Processor, two main tasks are performed
by Digital Processor: single and double event management and the
position reconstruction and energy correction of the events. These
tasks, as discussed in the next paragraphs, are crucial for the
correct scientific working of the Instrument.
A real time equalisation of the 7 PMTs is performed on-board by the
Automatic Gain Control System. For each event that is qualified as a
22 keV photon from the central Cd 109 calibration source the channel
value measured by each Photomultiplier is compared with the
correspondent reference channel experimentally determined during
on-ground calibration. If the measured channel is lower than the
reference channel the gain of the PMT is increased by a step DG
acting on the voltage of the phototube. On the contrary if the
measured channel is greater than the reference channel the gain of the
phototube is changed decreasing by a single step the voltage applied
to the phototube. For each PMT a gain variation of 0.1%, which
corresponds to 100 mVolt, has been chosen to maintain overall
fluctuations in Cd 109 peak position reconstruction around 0.5 %
FWHM. This choice, given the actual calibration source count rate,
allows equalisation of the system in less than a minute without
degrading the energy resolution.
2.3. The HPGSPC data structure
The HPGSPC instrument can be operated in three different telemetry modes:
- Direct Mode in which information is transmitted for every detected
and qualified photon. Five Direct Mode transmission option are
foreseen: Table 2 reports a list of the parameters transmitted with
the relative telemetry for each Direct Mode.
- Indirect Mode in which energy and burst length spectra for single
and correlated events are generated. For these integrated spectra the
number of energy channel (1024 for energy, 256 for burst length
spectra), the maximum content of each channel (8 or 16 bits) and the
accumulation time can be independently set.
- Indirect Temporal mode in which, beside the spectra generated in
Indirect Mode, energy spectra accumulated in 1 to 4 energy bands on
time scales down to 1 msec, are produced.
The total amount of telemetry allocated for the HPGSPC is 50 kBit/sec
and can go up to 100 kBit/sec if all the other instruments are in a
standby position. Due to telemetry constraints and depending on the
source count rate not all the information generated by the EU for
every event can be transmitted. The main observing mode is, therefore,
the Dir001 mode while the Dir004 is considered the diagnostic
operative mode. The latter has been extensively used during the
on-ground calibration and during the Commissioning and Science
Verification Phase to configure the instrument optimally and to
determine its response characteristic in flight. It will, also, be
used during periodic calibration of the instrument or to verify the
correct performances of the PMTs.
Whatever Operative Mode is selected, other information is telemetered
to the ground to monitor the detector status and performance:
- Calibration Spectra, four spectra (one for each Calibration Source),
generated every 128 seconds.
- Ratemeters to check the AC logic and Dead Time.
- Engineering HouseKeeping files which contain: ON/OFF status, Digital
Thresholds, Temperatures, Voltages, Collimator Status and Position.
3. Principle of operation
3.1. Fluorescence gated technique
Photoabsorption of X-rays below the Xenon K-binding energy at 34.5
keV, occurs in the L or lower order shells. In this case only a
single cloud is produced for each X-ray event, because the probability
of atomic relaxation via the Auger effect is much higher than via
fluorescence emission and in any case the mean penetration depth of
the L fluorescence photon, in 5 atmospheres Xenon, is less than 1
mm. For each X-ray event with E x /= 34:5 keV only a
single VUV burst will be produced and then detected by the HPGSPC.
Table 2. HPGSPC telemetry of Direct Modes
| Parameter | DIR001 | DIR002
| DIR003 | DIR004 | DIR005
|
|---|
| Arrival Time | 16 bit | 16 bit
| 16 bit | 16 bit | 16 bit
|
| Uncorrected Energy | --- | ---
| 12 bit | 12 bit | 12 bit
|
| Corrected Energy | 12 bit | 12 bit
| 12 bit | 12 bit | 12 bit
|
| Burst length | 8 bit | ---
| 8 bit | 8 bit | 8 bit
|
| 7 PMTs signals | --- | ---
| --- | 7 * 12 bit | 3 * 12bit
|
| Position in sector | --- | ---
| 12 bit | 12 bit | 12 bit
|
| Sector identity | --- | ---
| 4 bit | 4 bit | 4 bit
|
| Correlation Flag | 1 bit | 1 bit
| 1 bit | 1 bit | 1 bit
|
| Calibration Flag | 1 bit | 1 bit
| 1 bit | 1 bit | 1 bit
|
| Calibration identity | 2 bit | 2 bit
| 2 bit | 2 bit | 2 bit
|
| Total telemetry | 40 bit | 32 bit
| 68 bit | 152 bit | 100 bit
|
For incident X-ray energies above 34.5 keV, the probability that
photoabsorption occurs in the K shell is 86% while the probability
that atom relaxes via a Kalpha (29.7 keV) or a
Kbeta (33.8 keV) fluorescence photon is as high as
87%. Depending on geometry, filling pressure and energy of the
original X-ray event the fluorescence photon can be reabsorbed in the
gas cell, generating a second localized electron cloud at a different
point respect to the primary photoelectron cloud. The two electron
clouds from the double interaction (from now on referred as residual
and fluorescence) will enter the Scintillation Region with a time
difference of 40 -6sec, limited by the maximum drift time
in the Drift Region. In this case, a double VUV light burst associated
to a single X-ray event will be produced and detected by the
HPGSPC. The detection of a Kalpha or Kbeta
photon will ''gate'' the partial photoabsorption.
X-ray events above 34.5 keV can, however, interact with the L shell or
interact with the K shell and the atom relaxes via an Auger
electron. In these cases only a single cloud is produced. Finally, for
X-ray events that give rise to a Kalpha or Kbeta
fluorescence photon a single event can still be detected if the two
clouds are not spatially resolved or when the fluorescence photon
escapes the detector leaving only the residual energy deposit of E x t
and, in this sense, can be used to discriminate against a non X-ray
background event (Manzo et al. 1980, Ramsey et al. 1990, Dangendorf et
al. 1989).
The ''Fluorescence Gated'' technique can also be used to
improve the energy resolution above the Xenon K shell (Taylor et
al. 1981). Since the energy of the fluorescence photon is exactly
known, only the statistical fluctuations relative to the clouds of
primaries (residuals) will affect the energy determination.
3.2. Scientific modes of operation
Following the physics of photoabsorption three different
scientific modes have been defined for the HPGSPC and
implemented during the on ground data analysis :
- Single Event Mode (SE)
- Fluorescence Gated Mode (FG)
- All Events Mode (All)
In SE mode only X-ray photons detected as a single VUV light burst are
collected. The SE mode can be used in the HPGSPC whole range and is
the only mode for X-ray events with energy below 34.6 keV. In FG mode
only incident X-rays producing double correlated events are
accumulated. The FG mode is used only above 34.6 keV. In the ''All''
mode both ''Single'' and ''Double correlated'' events are
accumulated. Defined in the entire energy band of the HPGSPC, the
''All'' mode maximizes the detection efficiency of the Instrument.
3.3. Position reconstruction and energy correction
The HPGSPC energy resolution for a well collimated ''on axis'' X-ray
beam is determined in the first approximation by the statistical
fluctuations in the number of electrons produced in the absorption
region and the statistical fluctuations in the number of VUV photons
detected by the PMTs (i.e. the photon counting statistics). In the
case of the HPGSPC, considering a Fano factor of 0.15 (Anderson et
al. 1979) and the VUV light yield as reported in Nguyen et al. 1980, a
theoretical value for the energy resolution of 2.5% at 60 keV is
obtained ( in ''All'' mode).
When the HPGSPC is illuminated over the full geometrical aperture
(full area illumination) the energy resolution DE m=Em (where Em
is the measured energy i.e. the sum of seven PMTs signals) degrades
and only slightly depends on the energy. This is due to the dependence
of the measured energy Em on the (x,y) position at which the primary
electron cloud enters the Scintillation Region. Indeed, it is the
effective solid angle subtended by the seven PMTs (and then the VUV
scintillation light collected) that strongly depends on the (x,y)
scintillation position. Solid angle can vary from the center of the
detector to the walls by up to about 20% (Giarrusso et al. 1989). The
measured energy Em , however, can be corrected to the ''on axis''
value and the energy resolution can be restored just by multiplying
the measured energy Em by the Kcratio of the total effective solid
angle ''on axis'' to the total effective solid angle subtended by the
PMTs at the (x,y) point:
Ec = Em = WT(0,0)
/ WT(x,y)
= KcEm
with
WT(x,y) = å
Wi(x,y)
In the previous equationW T (x; y) is
the total solid angle subtended by the seven PMTs at the (x,y)
position and W i (x; y) is the solid
angle subtended by the PMT i. Although different methods have been
derived to determine a statistically optimum estimation of the
scintillation position for an array of PMTs operating in an Anger
camera configuration, they require difficult to implement onboard
hardware, or a long processing time (Giarrusso et al. 1995). The
method implemented for onboard position reconstruction and energy
correction processing makes use of the signal of the central PMT and
the highest signal of the lateral PMTs, to determine for each event
two energy independent coefficients which are defined as:
C0 = PMT0 / å PMTi
and
Cl = PMT0 / å PMTi
where PMT 0 is the signal detected by the central PMT and PMT l is the
highest signal among the lateral PMTs. Because there is an univoque
correspondence between the (x,y) position in a given sector and the (C
0 , C l ) space, once the C 0 and C l coefficients are obtained, the K
c correction factor is extracted from a look-up table that is
experimentally determined and implemented onboard as a memory matrix
of Kcvalues. Each value in the table is addressed by the C 0 and C l
coefficients measured for the event. To make the determination of the
Kcvalue faster, the look-up table is built using the isocoefficients
C 0 . Thus the look-up table is defined C 0 constant map. More
details on the position reconstruction and energy correction of the
event can be found in (Giarrusso et al. 1995, Giarrusso et al. 1989).
4. Instrument performance
During the on-ground calibration measurements, performed at Laben in
Milan, the DU-EU assembly was connected to the Instrument Test
Equipment (ITE) developed by Laben. The ITE is a computer controlled
system with a probe, the On Board Data Handling Bus Emulator and
Probe, that emulates the satellite OBDH bus. It retrieves data from
the HPGSPC-EU in the form of telemetry packets and send those data to
a VAX station via TCP/IP protocol. The on-line data handling, the
off-line processing and archival of data from ITE were performed by
the IFCAI calibration support system. A two axis PC controlled
translation stage was used to position collimated radioactive sources
in the relevant point of the entrance window of the detector. Test and
calibration of the HPGSPC were performed using four different
radioactive sources. Sources and relevant lines are given in Table
3. During the collimated measurements graded shield collimators (made
of Pb-Sn-Cu-Al) were used. A Co 60 (partially collimated) gamma ray
source was also used to simulate the gamma ray induced background
events.
Table 3. Calibration sources and lines.
| Source | line | Energy (keV)
|
|---|
| Fe55 | Mn Kalpha | 5.9
|
| Cd109 | Ag Kalpha | 22
|
| Cd109 | Ag Kbeta | 25
|
| Am241 | Nucl. line | 59.5
|
| Co57 | Nucl. line | 14, 122, 136
|
| Co60 | gamma | 1170, 1330
|
4.1. Burst length analysis
Burst length discrimination is a well established method to reduce the
background counting rate in GSPCs. The method, that in the case of the
HPGSPC is based on the ARC/CFT electronic chain (Leimann and Van
Dordrecht, 1979), essentially discriminates the pulse time duration
produced by the localised electron cloud generated by the absorption
of a genuine X-ray, against the extended ionisation track induced by
background particles interacting in the gas. Also background events
generated close to the detector walls by the interaction of gamma rays
or particles in the detector shielding are discriminated because of
their very short burst lengths.
For each event, the 20 - 80 % rise-time of the integrated sum signal
is measured. Only events within the experimentally determined upper
and lower thresholds are recognised as potential genuine X-ray
events. The full area burst length spectra relative to Cd 109 and Am
241 X-ray sources are shown in Figs. 5 and 6. The Cd 109 spectrum
follows a Gaussian distribution with a peak value at 3.74
-6sec and a resolution of 8.3 % FWHM. The burst length
spectrum of 59.5 keV photons of Am 241 is asymmetric with an extended
tail towards longer burst lengths. The peak position is at 3.73
-6sec and resolution is 8.6 % FWHM. The tail is due to
events in which the residual and fluorescence clouds overlap,
scintillating for a longer duration.
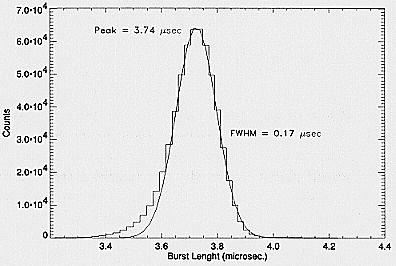 Fig. 5. Burst length spectrum of the 22 and 25 keV lines of
Cd 109 radioactive source. Continous line is the best gaussian
fit to the experimental measurement.
In Fig. 7 we show the burst length versus energy diagram for the 22
and 25 keV line of Cd 109 . Events labeled with (1) are associated
with Cadmium events absorbed in the Drift Region while the extended
tail (2) is correlated with events that penetrated deep into the
Scintillation Region. These events, scintillating for a shorter time,
give rise to a detected events with lower energy and burst length.
For incident photons with energies above the Xenon K-shell the
situation is more complex. Fig. 8 is an exposure at 59.5 keV photons
from Am 241 radioactive source. The events labeled with (1) are
associated with 59.5 keV events that have been detected as ''Single''
i.e. events originating a single electron cloud. The burst length
distribution relative to these events shows a very long tail (2)
towards longer burst lengths. As mentioned above, these are events
that generated a fluorescence photon whose cloud overlaps the residual
cloud. Events labeled with (3) are associated with the
Kalpha and Kbeta fluorescence photons and the
Kalpha and
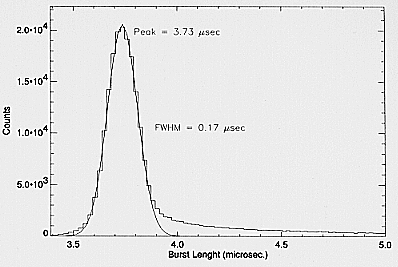 Fig. 6. Burst length spectrum of the 59.5 keV line of Am 241
radioactive source. The long tail towards longer burst lengths
is due to events which give rise to overlapping residual and
fluorescence electron clouds.
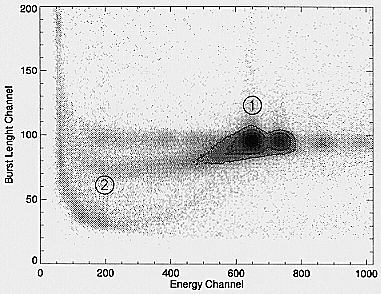 Fig. 7. Burst length versus energy diagram for 22 and 25 keV
photons from Cd 109 radioactive source. See the text for a description of the labels. Scale is logarithmic
Kbeta escape peaks. Tails are not present for these events
associated with a single electron cloud. Events absorbed in the
Scintillation Region give rise to the ''strips'' (4) that connect the
source region with the dense region at lower energy and lower burst
length (5). The latter is associated with the low- energy features
that are due to 59.5 keV Am 241 events absorbed in the Back Region
which, scintillating close to the wires of scintillation grid along
paths of anomalous electric field, generate small short pulses. All
the features described above are well summarised by the Co 57 burst
length versus energy diagram shown in Fig. 9. All the ''genuine''
X-rays peaks are distributed in a very narrow region that run almost
parallel to the corrected energy axis, confirming that the burst
length distribution is independent of the energy of incident
Xrays. Long tails are associated with the primary release plus
overlapping fluorescence for the primary lines at 136, 122, 59 and 67
keV of Cobalt (1), (2), (3) and (4) while tails disappear in the peaks
at 92.3 keV and 88.3 keV (associated with residuals (5)) and at 29.7
and 33.8 keV (associated with fluorescence photons (6)). The 58.9 and
67.6 keV lines are respectively the Kalpha and
Kbeta fluorescence photons of the Tungsten (that shielded
the Cobalt radioactive source) induced by the 136 and 122 keV photons
of the Co57.
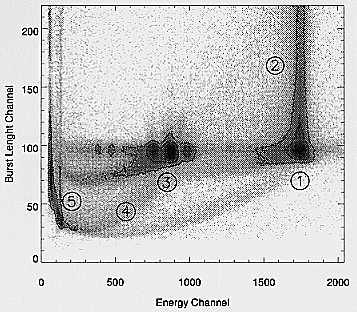 Fig. 8. Burst length versus energy diagram for 59.5 keV photons from Am 241 radioactive source.
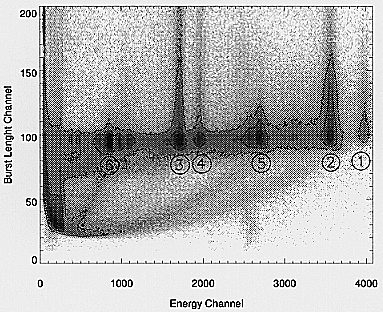 Fig. 9. Burst length versus energy diagram relative to Co 57
illumination. Labels are explained in the text.
In order to reject events absorbed in the Scintillation and Back
Region, the burst length lower threshold was set at 3.5
-6sec, independent of the energy of the primary events. The
upper threshold will probably depend on the energy of the incident
photon. For events with energy below the Xenon K-shell the upper
threshold will be set around 3.85 -6sec, narrowly around
the peak of bl versus energy distribution. For events above the Xenon
K-shell the upper thresholds has to be set to maximise the signal to
background ratio which will depend on the in orbit HPGSPC background.
4.2. Results on position reconstruction and Energy correction
Due to the hexagonal symmetry of the HPGSPC the look-up table need in
principle be determined only in a 30o degrees sector that
is assumed as reference sector and then extended to the entire area of
the instrument with an appropriate set of rotations and
reflections. The physical symmetry of the HPGSPC was verified by
sampling all the sectors using the response to the 22 keV peak line of
Cd 109 in 20 different points per sector. Only the reference sector
was carefully mapped in 120 points. Fig.10,11,12 show the isocontours
relative to C 0 , C l coefficients and to the Kccorrection
factor. The dashed lines plot is obtained from the experimental
measurements, while a continuous line map is generated with a
symmetrical mapping of the reference sector on the whole area of the
detector. While for the C l coefficient the two mapping are in good
agreement (differences are less than 2 %), showing that the gains of
the lateral PMTs were correctly equalised, the asymmetry in the K c
contours is a consequence of the shift present in the C 0
contours. This is due to a misalignment between the geometrical centre
of the detector and the optical centre of the central PMT. Simulation
show that even a quite small misalignment (less than 1 mm and/or 1
degree) can have an impact (up to 10% for r greater than 10 cm) in the
Kc factor in some of the sectors. The imperfect reconstruction in
these sectors affects the energy resolution and gives rise to a
deviation from the gaussian distribution of the reconstructed lines.
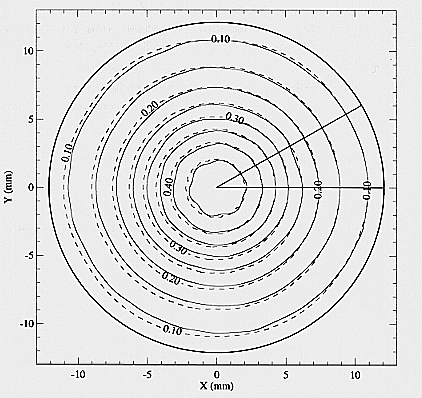 Fig. 10. Isocontours of the C0 coefficient relative to the whole
detector open area. Dashed lines are from experimental mapping in all
sectors, while continuous lines are generated with a symmetrical
mapping of the reference sector.
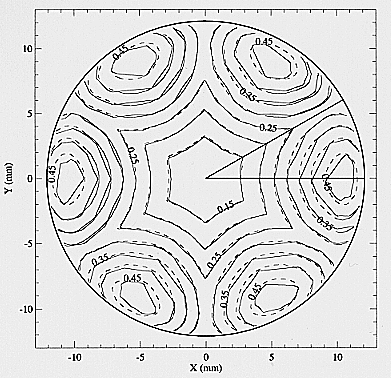 Fig. 11. Isocontours of the C l coefficient. The two mapping are
in good agreement showing that lateral PMTs were correctly
equalised.
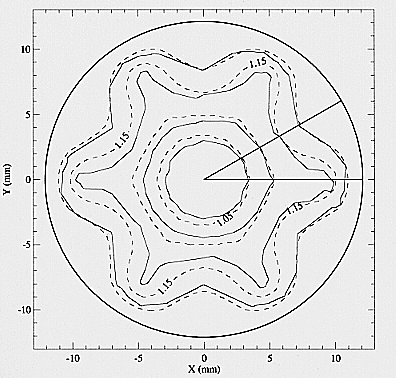 Fig. 12. The Kc correction factor isocontours: asymmetry is
clearly visible.
To minimise the effect of the asymmetry, we derived directly a (C 0 ,
C l ) distribution for a long measurement of a Am 241 59.5 keV source
illuminating the full area of the entrance window (see Fig. 13). Of
course,the (C 0 , C l ) distribution does not depend on the energy of
the calibration line used. The C 0 constant map can then be obtained
just by subdividing the (C 0 , C l ) coefficient distribution in
rectangular areolas whose vertices belongs to C 0 isolines, (see
Fig. 13).
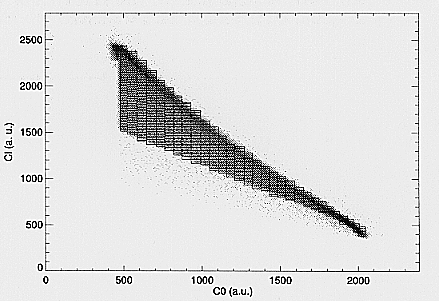 Fig. 13. The (C0 , C l ) distribution for the 59.5 keV line of
Am 241 .
For each areola i the Kcfactor can be defined as:
Kc(i) = Peak(0) / Peak(i)
where Kc(i) is the correction factor of areola i, Peak(0) is the
peak of the 59.5 keV line of Am 241 in the energy spectrum collected
in the central areola and Peak(i) is the peak of the 59.5 keV line of
Am 241 in the energy spectrum collected in the i areola. It must be
stressed that the effects of asymmetry are averaged because photons
collected in each (C 0 ,C l ) areola are indeed physically detected in
(x,y) positions, which differ from sector to sector.
The areolas are iteratively determined in such a way that a finer
discretisation does not improve the energy resolution in the local (C
0 ,C l ) region. As a consequence, the variation of the correction
factor DKchas been determined to be less than 1% in the outer
areas of the (C 0 , C l ) distribution while DKcis less than
0.5 % in the inner region (where the local energy resolution is better
due to the higher yield).
The correct working of the energy reconstruction algorithm is a key
point for the optimum scientific operation of the HPGSPC. This is
illustrated in Fig. 14 in which both the unreconstructed and
reconstructed full area raw energy spectra of a Am 241 radioactive
source, are shown. The source was positioned 3 meters from the
entrance beryllium window in order to illuminate the whole entrance
area of the detector. Both single and correlated events are
accumulated.
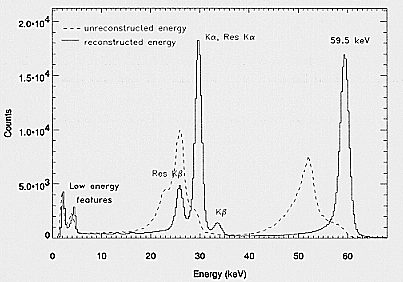 Fig. 14. Reconstructed and unreconstructed energy spectra of
Am 241 radioactive source.
The unreconstructed spectrum is strongly distorted, shifted towards
the lower channels and the lines are not well resolved. In the
reconstructed raw spectrum the Am 241 59.5 keV line is clearly
detected and peak position is correctly reconstructed. The three,
rather well resolved, lines at 25.7 keV, 29.7 keV and 33.8 keV
correspond respectively to the Kbeta residual peak (E x
-Kbeta ), the Kalpha fluorescence of the Xenon
that overlap the Kalpha residual peak (E x
-Kalpha ) and the Kbeta Xenon fluorescence. The
two low energy features clearly visible in the spectrum below 10 keV
are due to Am 241 59.5 keV photons absorbed directly in the Back
Region which give rise to an electron cloud scintillating very close
to the scintillation grid wires along anomalous paths. However as
described in the previous paragraph this undesirable features can be
almost totally rejected by burst length selection. The HPGSPC
resolving power in the entire operative range is shown in Fig. 15
where both unreconstructed and reconstructed energy spectra of a Co 57
radioactive source are given.
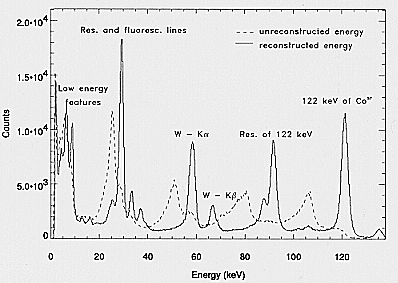 Fig. 15. Reconstructed and unreconstructed energy spectra of
Co 57 radioactive source. Low energy features are due to events
absorbed in the Back Region. Kalpha and Kbeta
lines, emission from Tungsten is also visible.
Low energy features are quite enhanced as expected because of the
longer penetration depth of higher energy photons. In the
reconstructed spectrum two lines at 13.5 keV and 16.8 keV are
visible. They are due to Uranium contamination (Lalpha and
Lbeta lines) in the beryllium window.
4.3. Spectroscopic performance
In Fig. 16 we show the full area corrected energy spectrum of the 22
keV and 25 keV lines of a Cd 109 radioactive source in which
background has been subtracted and burst length thresholds have been
applied. A double gaussian fit is also shown. The agreement is not
perfect because of residual distortion of the reconstructed spectrum
in some of the sectors and due to discretisation in the Kclook-up
table that can introduce a deviation of the counting statistics from
the poisson distribution. The deviation from a gaussian nature is
modeled in the response matrix of the instrument. In Fig. 17 we report
the full area energy corrected spectrum of an Am 241 radioactive
source after background subtraction and burst length selection. The
spectrum has been accumulated in Single Mode. Line at 59.5 keV
contains, then, only events that have been detected as ''Single''. The
tail towards lower energies is due to double events that scintillate
in spatially separated centres but overlap in burst time and then give
rise to a non correctly detected light production centre. The line
resolution is 3.3% +/- 0.1% FWHM. The other two peaks at 25.7 keV and
29.8 keV correspond to the Escape Kalpha and Escape
Kbeta i.e. to events for which the fluorescence photon exit
from the detector. The low energy features relative to the events
absorbed in the Back Region are much reduced in intensity. The
Fluorescence Gated spectrum is shown in Fig. 18 (the background has
been subtracted and burst length thresholds have been applied). Only
events detected as ''Double'' are accepted if at least one of the
events has an energy determined to lie within +/- 3 oe of either the
Kalpha or Kbeta fluorescence energy, and if this
is the case, the exactly known energy of the Kalpha or
Kbeta line is summed to the measured energy of the
residual. As can be seen in the figure, the energy resolution in FG
mode is improved with respect to that obtained in SE mode by up to
2.4%. The spectroscopic performances of
![Energy spectrum]() Fig. 16. Full area energy spectrum of 22 and 25 keV lines of
Cd 109 radioactive source
Fig. 16. Full area energy spectrum of 22 and 25 keV lines of
Cd 109 radioactive source
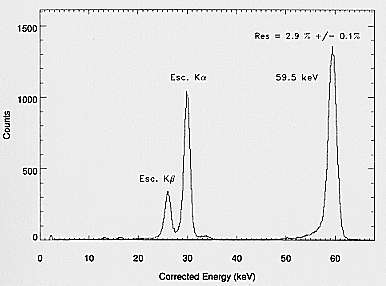 Fig. 17. Corrected energy spectrum of 59.5 keV line of Am 241
as seen by HPGSPC in Single Event Mode.
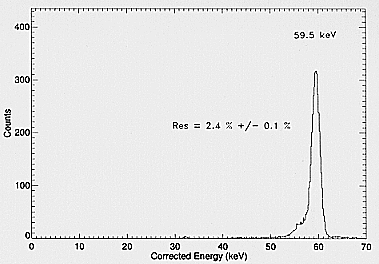 Fig. 18. Corrected energy spectrum of Am 241 in Fluorescence
Gated mode.
the HPGSPC summarised in Fig. 19 where the energy resolution as a
function of the energy is shown over the entire energy range of the
HPGSPC. Both SE and FG mode are shown. The figure also shows, for
comparison, the energy resolution as a function of energy for narrowly
collimated ''on-axis'' X-ray sources. The full area curve can be
fitted with the following relation:
DE /
E = 3:30 (E / 60keV)-0.46
The deviation from the E-0.5 law, observed with narowly
collimated illumination, results from the discretization (Giarrusso et
al., 1989).
4.4. Energy linearity
The detector's linearity has been verified for the response to both
collimated and full area X-ray illumination. Results are shown in
Fig. 20 where all lines and residuals are reported. The channel to
energy conversion is given:
E = -0.16 + 0.0342 x PHA
for the SE mode and
E = 0.03 + 0.0342 x PHA
for the FG mode. The slight difference between the two modes is due to
a small offset difference between the two electronic chains. Because
of the limited number of energy lines we could not find any evidence
for the gain discontinuity around the Xenon K-edge where a jump of 177
eV has been recently measured (dos Santos G.M.F. et al. 1994). A
L-jump discontinuity at 4.78 keV of about 110 eV has been also
measured by many authors (dos Santos et al., 1993, Lamb et al., 1987,
Boella et al., 1996). This
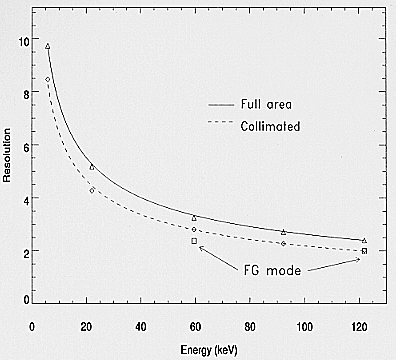 Fig. 19. Energy resolution versus energy: both full area and
collimated case are given. Small squares show the
energy resolution in FG mode.
effect is small for the HPGSPC, because, due to the window thickness,
the detection efficiency at that energy is low. Both the K and L jump
have been, however, modelled and introduced in the response
characteristic of the detector.
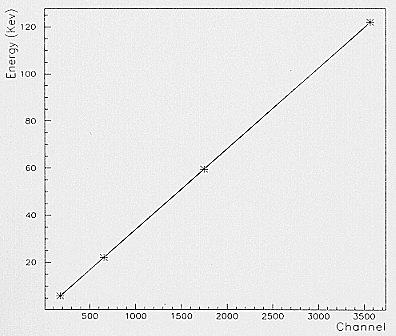 Fig. 20. Energy linearity
4.5. Effective area and response matrix
The effective area of the HPGSPC is mainly limited at low energies by
the transmission of the beryllium entrance window, while at higher
energies it is limited by the efficiency of absorption of X-rays in
Xenon. in Fig. 21 we show the HPGSPC effective area as a function of
energy. In the calculation have been taken into account the predicted
transparency of collimator (around 75%), the beryllium window
transmission and the reduction factor due to the efficiency of
electronics to recognise a true X-ray.
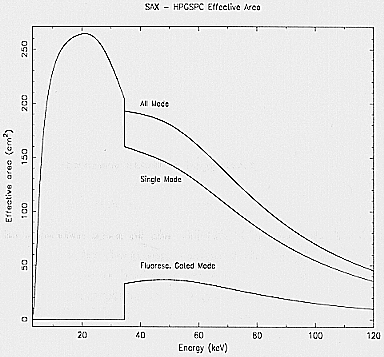 Fig. 21. HPGSPC Effective Area
In order to obtain the complete response matrix of the instrument, the
redistribution matrix has been experimentally determined. The
redistribution matrix depends, of course, on the energy resolution and
on the distribution of the response to a monochromatic line, but it
depend also (above 34.6 keV) on the escape fraction probabilities of
Kalpha and Kbeta fluorescence photons. Table 4
shows the experimentally determined escape fraction probabilities for
the Kalpha and Kbeta fluorescence photons for an
incident energy equal to 59.5 keV (Americium source) and to the 122
and 136 keV of the Co 57 lines. Escape probabilities have been
normalized with respect to the total number of detected events in SE
mode.
4.6. Background rejection analysis
Several components contribute to the background level
of the HPGSPC. A major background source (Mason et
al. 1983) is the diffuse isotropic atmospheric and Cosmic
X and gamma ray component that manifests itself as an
aperture flux that depends upon the Field of View of the
Table 4. Escape probabilities for the Xenon Kalpha
and Kbeta fluorescence photons
| Fluorescence Photon | energy | value
|
|---|
| Kalpha | full area 60 keV | 27.4%
|
| Kbeta | full area 60 keV | 9.1%
|
| Kalpha | full area 122 keV | 25.3%
|
| Kbeta | full area 122 keV | 9.7%
|
collimator and as an indirect background induced through shield
penetration. A second component is due to primary cosmic rays (mostly
protons) and geomagnetically trapped particles that interact directly
in the detector or, interacting with the spacecraft, giving rise to
gamma rays which in turn penetrates the detector through the shielding
and interacting with the detector walls or filling gas producing
energetic Compton electrons. A third component is due to electrons and
neutrons mainly produced as a result of the primary cosmic ray
interaction with the atmosphere.
As the HPGSPC is a background dominated instrument for most sources,
background reduction is extremely important. It is be achieved in
three ways:
- Passive shielding. 1mm of lead and 2 mm of tin cover
all direction other than the field of view of the instrument.
- Burst length selection. As we already described only events that
produce a VUV light burst whose duration is within the upper and lower
thresholds (experimentally determined for X-rays) are recognised as
''genuine'' events.
- Radius selection. Events detected outside a selected radius (maximum
value is 12 cm) are rejected as background events coming from the
detector wall.
Precise simulation of the in-orbit background is practically impossible on the ground. However, to provide an
insight into the background rejection capabilities of the
HPGSPC two ''on ground available'' background sources
have been used: the environmental background at Laben
Clean Room (that is the sea level cosmic ray flux) and a
Co 60 gamma ray source (1.17/1.33 Mev gamma rays) that
can mimic the in-orbit background component of energetic
Compton electrons. In Fig. 22 we show the energy reconstructed spectrum of the background (both environmental
and Co 60 induced background) as seen by the HPGSPC.
In order to evaluate and optimise the background
rejection efficiency of a X-ray detector, such as the
HPGSPC the statistic S defined as:
S = Ax(Ex) /
( 1 - Rb(Ex) )½
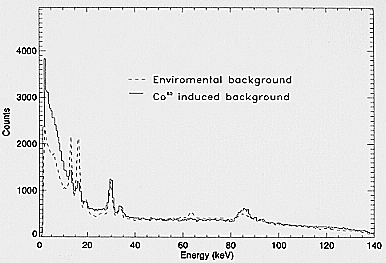 Fig. 22. Environmental and Co 60 induced background as seen
by the HPGSPC.
rays, with energy E x , accepted by burst length selection with
respect to the total number of X-rays events recorded by the HPGSPC
and R b ( E x ) is the fraction of background events rejected because
of burst length selection with respect to the total background. The
variation of burst length efficiency R b with A x is shown in Fig. 23
along with the Statistic S, for the 22 keV line of Cd 109 source. The
two curves correspond to the environmental background at Laben and to
a Co 60 induced background. As S should be maximum, the optimum
rejection efficiency R b occurs at 55% with an acceptance A x of 90%.
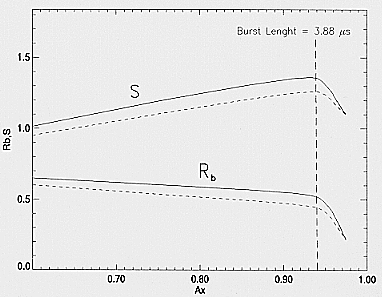 Fig. 23. Background rejected and Statistic S versus energy for Cd
109 source: dashed lines correspond to environmental background;
continuous line is for Co 60 induced background. The vertical line
corresponds to a choice of burst length window narrowly selected
around the burst length of genuine X-ray events.
Above 34.6 keV the situation is different. In Fig. 24 the variation of
R b is shown for the 59.5 keV line of Am 241 . A Maximum is obtained
when the upper burst length thresholds is fully open. This is due to
the long tail that is present in the Americium burst length
spectrum. The vertical line in Figs. 23 and 24 corresponds to a choice
of burst length window narrowly selected around the burst length of
genuine X-ray events. Finally in Fig. 25 we show the burst
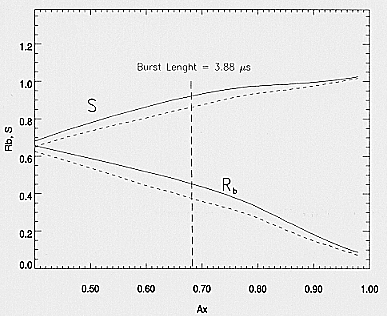 Fig. 24. Background rejected and statistic S versus energy for
an Am 241 source.
length rejection efficiency as a function of X-ray photon
energy for an X-ray acceptance efficiency of 80%. Only
events with energies within of the X-ray lines are considered.
The background rejection efficiency R k in Fluorescence Gated mode has
been measured using both a Co 60 gamma ray source and the
environmental background (Sims et al., 1983). R k has been measured in
a narrow band around the reference energy and the results are shown in
Table 5.
Several components contribute to the residual FG background. First,
fluorescent photons can be produced by the interaction of charged
particles (mostly protons and Compton electrons) with the Xenon K
shell electrons (Manzo et al. 1980, Middleman et al. 1967). Secondly,
Compton scattered gamma rays have a 4% probability of producing
fluorescence photons by interacting with the Xenon K-shell
electrons. However, only a minor difference has been found between the
Co 60 and cosmic ray induced backgrounds. This suggests, in good
agreement with Sims et al. (1983) and Ramsey et al. (1990), that, for
the HPGSPC, the majority of the FG background is produced by high
energy photons which scatter many times in the detector shielding and
body and are ultimately absorbed in the Xenon via photoelectric
interaction, showing the same indistinguishable ''fingerprint'' as
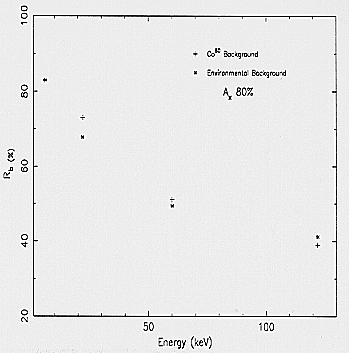 Fig. 25. Burst length versus energy for an X-ray acceptance
efficiency of 80%
genuine X-rays. An estimate of the influence of the above described
components is currently beig determined. Table 5 summarises, the
background rejection efficiency at various incident photon energies E
x using both burst length discrimination and the FG technique.
Table 5. Rejection efficiency
| Background | Ref energy | Rk | Rkb
|
|---|
| Co60 | 40 keV | 91% | 98%
|
| Co60 | 60 keV | 92% | 94%
|
| Co60 | 90 keV | 93% | 95%
|
| Env. bck. | 40 keV | 92.9% | 98%
|
| Env. bck. | 60 keV | 85.4% | 93%
|
| Env. bck. | 90 keV | 90.9% | 92.7%
|
5. Post launch addendum
On April 30th 1996 BeppoSAX was successfully launched from Cape
Canaveral. Following launch the satellite was commissioned for two
months. On June 22 1996 the HPGSPC made its first observation of a
celestial X-ray source the black-hole candidate Cyg X-1. At the time
of writing the HPGSPC is completing the Science Verification Phase
observing a number of well known X-ray source.
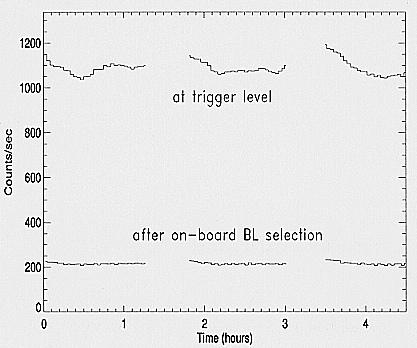 Fig. 26. Background count rate observed by the HPGSPC during in
flight operation. Three consecutive orbits are shown. The upper curve
refers to the count rate measured at the trigger while the bottom
curve shows the residual background after on-board burst length
selection.
Characterisation of background is one of the main goal
of the Science Verification Phase. Very preliminary results show that while the count-rate at the Trigger level
is about a 10 3 counts/sec after on-board burst length selection the background is reduced to 2 \Lambda 10 2 counts/sec.
Moreover, as can be seen in Fig. 26 the background is
clearly modulated with the orbit. If the FG technique is
applied the background count rate is reduced to 3:5 \Lambda 10
of the photons coming from the calibration sources. We are currently
working to optimally configure the instrument in order to
reduce this effect. A complete in-flight characterisation of
the instrument and its performances will be subject of a
future paper.
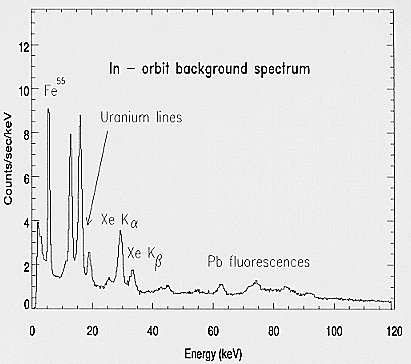 Fig. 27. Background spectrum as observed by the HPGSPC
during the Commissioning Phase. The Fe 55 line is due to events
from calibration sources not well subtracted. Pb fluorescences
are due to the 88 keV component of the Cd 109 calibration
source.
6. List of acronyms
- AGC Automatic Gain Control
- ASI Agenzia Spaziale Italiana (Italian Space Agency)
- DU Detector Unit
- EU Electronic Unit
- FEE Front End Electronics
- FG Fluorescence Gated
- GSPC Gas Scintillation Proportional Counter
- HPGSPC High Pressure Gas Scintillation Proportional Counter
- ITE Instrument Test Equipment
- LECS Low Energy Concentrator System
- MECS Medium Energy Concentrator System
- NFI Narrow Field Instrument
- OBDH On Bord Data Handling
- PDS Phoswich Detection System
- PMT Photomultiplier
- SAX Satellite Astronomia X
- VUV Vacuum Ultra Violet
- WFC Wide Field Cameras
Acknowledgements
This research has been fully supported by the Italian Space Agency in
the framework of the SAX program. We wish to thank Prof. L. Scarsi,
Chairman of the SAX Scientific Steering Committee and Dr. Chris
Butler, SAX payload manager, for their continuous support and
encouragement.
References
- Anderson D.F., Hamilton T.T., Ku W. H. et al., 1979, Nucl. Inst. & Methods, 163, 125
- Boella G., Chiappetti L., Conti G. et al., 1995, Proc. SPIE 2517, 223
- Dangendorf V., Schmidt-Bšocking H., Breskin A. et al., 1989, Proc. SPIE 1159, 192
- Dos Santos G.M.F., Bento A.C., Conde C.A. et al., 1994, Nucl. Inst. & Methods, 350, 316
- Frontera F., Butler C., Costa E. et al., 1995, Proc. SPIE 2517, 249
- Gedanken A. Jorter J., Raz B. et al., 1972, J. Chem. Phys. 57, 3456
- Giarrusso S., La Rosa G., Manzo G. et al., 1989, Proc. SPIE 1159, 514
- Giarrusso S., Santangelo A., Fazio G. et al., 1995a, Proc. SPIE 2517, 234
- Giarrusso S., Manzo G., Santangelo A. et al., 1995b, Nucl. Inst. & Methods A 354, 567
- Jager R., Heise J., Mels W.A. et al., 1995, Proc. SPIE 2517, 261
- Johnson N. et al., 1994, Proc. of the 2nd Compt. Obs. Symp. eds C.E. Fichtel et al. New York, 515
- Leimann E. A. and Van Dordrecht A., 1977, Nucl. Inst. & Methods A 146, 399
- Manzo G., Davelaar J., Peacock A. et al., 1980, Nucl. Inst. & Methods A 177, 595
- Makishima K., Mihara T., Nagase F. et al., 1991, Proc. of 28th Yamada Conference on Frontiers of X-ray Astronomy, eds. Y. Tanaka and K. Koyama
- Martin D.D.E.. Bavdaz M., Peacock A. et al., 1995, Proc. SPIE 2517, 209
- Mason I.M. and Culhane J.L., 1983, IEEE Trans. Nucl. Scie., NS-30, No. 1, 485
- Nguyen Ngoc H., Jeanjean J.,Itoh H. et al., 1980, Nucl. Inst. & Methods 172, 603
- Piro L., Scarsi L. and Butler C., 1995, Proc. SPIE 2517, 169
- Ramsey B.D., Bower C. R., Dietz K. L. et al., 1990, Proc. SPIE 1344, 82
- Sims M.R., Manzo G., Peacock A. and Taylor B.G., 1983, Nucl. Inst.& Methods 211, 499
- Scarsi L., 1993, A&A 97, 371
- Taylor B. G., Andresen R. D., Davelaar J. et al., 1981, IEEE Trans. Nucl. Scie. NS--28, 861
- Trümper J., Pietsch W., Reppin C. et al., 1978, ApJ 219, L105
- Wheaton Wm. A., Doty J. P., Primini F. A. et al., 1979, Nature 282, 240
