The low-energy concentrator spectrometer on-board the
SAX X-ray astronomy satellite
A.N. Parmar, D.D.E. Martin, M. Bavdaz, F. Favata, E.
Kuulkers, G. Vacanti, U. Lammers, A. Peacock, and B.G. Taylor
Astrophysics Division, Space Science Department of ESA, ESTEC,
Postbus 299, 2200 AG Noordwijk, The Netherlands
Abstract
The payload of the Italian/Dutch spacecraft
SAX includes a set of four X-ray concentrators each of
geometric area 124 cm 2 together with imaging gas
scintillation proportional counter detectors located at the focal
planes. One of these detectors, the Low-Energy Concentrator
Spectrometer (LECS), is sensitive to X-rays in the
energy range 0.1-10 keV, while the other three cover a
narrower energy range of 1.3-10 keV. In order to achieve the
extended low-energy response of the LECS a novel type of
gas scintillation proportional counter has been developed
which dispenses with the separate drift and scintillation
regions of conventional instruments. The design and
performance of the instrument together with its calibration
and data analysis system are described here.
Key words: Instrumentation: detectors - Methods: data
analysis - Methods: observational - Techniques:
spectroscopic - X-rays: general
Send offprint requests to: A.N. Parmar: aparmar@astro.estec.esa.nl
1. Introduction
SAX is an Italian/Dutch spacecraft that will be placed
into low-Earth orbit by an Atlas I launch vehicle in spring
1996. The nominal orbit is circular at a height of 600 km
with an inclination of
4
o
to the equator in order to
take maximum advantage of the shielding of the Earth's
magnetic field. During the expected lifetime of up to 4
years, SAX will make 2000-3000 observations of cosmic
X-ray sources over the unprecendently wide energy range
of 0:1 , nonimaging spectroscopy in the energy range 3-300 keV and
variability studies of X-ray source intensities and spectra
on timescales from milliseconds to months (Perola 1983).
Mission operations will be conducted from Rome, Italy
and are designed to allow a flexible response
to any targets of opportunity.
The payload consists of the Phoswich Detector System (PDS),
the High Pressure Gas Scintillation Proportional counter
(HPGSPC), two Wide Field Cameras
(WFC), three imaging Medium Energy Concentrator Systems
(MECS) and the imaging Low Energy Concentrator
System (LECS). All the instruments are coaligned except
for the WFCs which point in opposite directions along an
axis perpendicular to the other instruments. Each imaging
GSPC is located at the focal plane of an X-ray concentrator
system. In order to extend the sensitive range of the
imaging spectrometers to 1.3 keV, the LECS dispenses
with the separate drift and scintillation regions of
conventional GSPCs and utilizes an extremely thin entrance
window. This instrument was provided by SSD and is described
here. Its primary objective is to provide better
energy resolution at low energies than currently available
non-dispersive detectors and so to open up new areas of
astrophysical interest.
The last few years have been an exciting time for Xray
astronomy with the launches of the ROSAT, ASCA
and XTE satellites. ROSAT provides high sensitivity and
spatial resolution in the 0.1-2.5 keV energy range, but
with only moderate spectral resolution (Trümper 1983).
XTE concentrates on timing studies in the 2-200 keV energy
range with moderate spectral resolution (Swank et al.
1995). The ASCA payload consists of both imaging CCD
and GSPC detectors (Tanaka et al. 1994). The CCD detectors
provide an energy resolution,
D E, of 100-150 eV over
the ~0.5-10 keV energy range, while the GSPCs provide
D E ~500 eV at 6 keV over the energy range 1.0-10 keV.
The good spectral and spatial resolutions, robustness and
low power requirements of CCD detectors have ensured
that they have become the preferred detectors for future
X-ray spectroscopic investigations (Weisskopf 1987; Big
nami et al. 1990; Wells et al. 1992). While their development
is still proceeding, it is worth comparing their
properties with those of GSPCs:
- The resolution of a typical GSPC detector at 6 keV
of 500 eV is a factor ~4 worse than a CCD. However,
the resolution, scales approximately as E 1=2 and so becomes
comparable to that of CCDs at low ( ~ 0.5 keV)
energies.
- GSPC detectors provide extremely good time resolution of up
to a few ms. This should be compared with a
time of ~2 s needed to read out a typical CCD. CCD
time resolution can be improved to tens of ms by continuously
reading the device. The spatial distribution
of the observed X-rays then represents timing information.
- In X-ray astronomy CCD detectors are used in photon counting
mode. This means that the mean arrival rate should be
0.1 photons pixel
known to be extremely stable, whereas there are still concerns as to
the effects of large radiation doses on CCDs (e.g., Holland et al. 1990).
- GSPCs have good background rejection capabilities
using a variety of techniques over and above those used
by CCDs.
2. LECS description
The LECS consists of Mirror, Detector, Electronics and
Gas Units. The Mirror Unit is provided by the Italian
Space Agency (ASI). The major components of the SSD
provided units are shown in Fig. 1 and the overall
performance is summarized in Table 1.
2.1. Mirror unit
A total of four flight Mirror Units (MUs) and one
qualification model have been produced. The LECS uses unit
FM3. Each MU consists of 30 nested, Au coated, confocal
mirrors with a double cone approximation to Wolter
I geometry (Citterio et al. 1985). The geometric area is
124 cm 2 and the mirror diameters range from 16.2 to
6.8 cm. The shell thicknesses range from 0.4 to 0.2 mm
and the nominal focal length is 185 cm. The total length
of each mirror shell is 30 cm. The mirrors were produced
using a replication technique by nickel electroforming from
super-polished mandrels. The calibration and performance
of the flight MUs is described in Conti et al. (1994).
In order to deflect any plasma that might pass through
the MU, a plasma protection grid is mounted on the
underside of the unit. This consists of a fine pitched
Aucoated W grid. In flight, the grid will be placed at +28 V
Table 1. LECS overall performance summary
| Parameter | Value
|
| Energy Range | 0.1-10.0 keV
|
| Energy Resolution at 0.28 keV | 32% FWHM
|
| Energy Resolution at 6 keV | 8.8% FWHM
|
| Angular Resolution at 0.28 keV | 9.'7 FWHM
|
| Angular Resolution at 6 keV | 2.'1 FWHM
|
| Effective Area at 0.28 keV | 22 cm2
|
| Effective Area at 6 keV | 50 cm 2
|
| Field of view | 37' diameter circular
|
| Entrance window size | 20 mm diameter
|
| Image scale | 1.86 mm-1
|
| Time Resolution | 16 micro sec
|
| Maximum Thruoghput | 2000 events/s
|
| Energy Spectrum | 1024 channels
|
| Image size | 256 by 256 pixels
|
| Pixel size | 17."4 by 17."4
|
2.2 Detector unit
The Detector Unit (DU) consists of a gas cell,
a photomultiplier tube (PMT), Front End Electronics (FEE) and
two high-voltage supplies. The detector is protected by
an Al cover on which a shutter mechanism is mounted.
The shutter will be opened once in orbit. The detector
is protected against space plasma ingress by a protection
window located just beneath the shutter and by the MU
plasma protection grid described in Sect. 2.1. The protection
window consists of two layers of Polyimide with
a total thickness of 200 nm, separated by a layer of AlN
and coated with a layer of AlN and C on the external
surfaces (Fig. 2). Mechanical strength is provided by a
250 mm hexagonal Polyimide grid.
The top cover has a
thin Be disk mounted on its interior upper surface
in order to minimize any X-ray background induced by electron
emission from the gas cell top disk which is at a potential
of -20kV.
Each source produces Mn Kalpha and Kbeta X-rays (5.89
and 6.49 keV, respectively) at a rate of 20 counts s
X-ray which is absorbed in the cell gas liberates a cloud
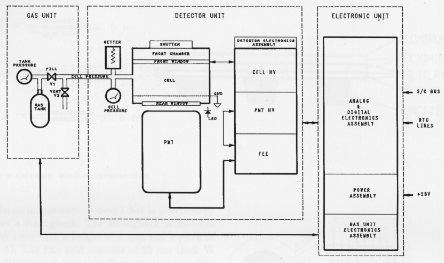 Fig. 1. LECS instrument schematic
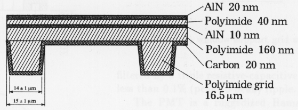 Fig. 2. Plasma protection window cross-section
of electrons. A uniform electric field between the entrance
window kept at -20 kV
is proportional to the energy of the incident
X-ray but, unlike a conventional GSPC, also depends on
the depth at which the X-ray photon was absorbed. This
depth is determined by measuring the duration of the
scintillation light and is referred to as the ``Burstlength''. Thus
an X-ray absorbed deep within the gas cell will have a
shorter burstlength than one absorbed directly below the
entrance window. The negative potential on the window
and the high electric field ensure that electrons created by
X-rays absorbed just beneath the entrance window have
a high probability of entering the scintillation process.
The gas cell is a 11.4 cm diameter ceramic cylinder of
depth 5 cm with a metallic top disk and lower flange. The
PMT is mounted 1 mm from the quartz gas cell exit window.
The cell is filled with Xe at a nominal pressure of
1.1 bar at 20o C. GSPCs are extremely sensitive
to impurities and a getter is included to passively absorb small
amounts of gas impurities. The getter can be activated
by a current source once it has reached saturation. The
gas cell has an extremely thin multi-layer entrance window
consisting of three layers of Polyimide separated by
Al/AlN multilayers. This construction was chosen to minimize
the leak rate and sensitivity to atomic oxygen corrosion. The
nominal thickness of the window is given in
Table 4 and its cross-section is shown in Fig. 3. The Al
and AlN layers act as gas permeation barriers while the
Polyimide provides mechanical support. The strength to
 Fig. 3. Detector entrance window cross-section
support a differential pressure of over 1 bar is provided by
a fine grid and a strongback. The strongback is made of
50 mm thick W bars with a height of 3 mm and a pitch of
2.2 mm (Fig. 4). The fine grid consists of 25 mm thick W
foil which subdivides each strongback square into a matrix
of 8 by 8 squares (Fig. 5).
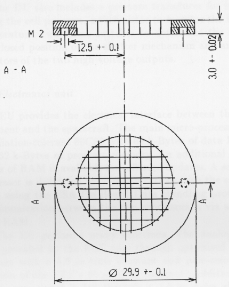 Fig. 4. Entrance window strongback structure
The high voltage power supplies provide power to the
gas cell and to the PMT. The cell voltage is commandable
in 31 steps between
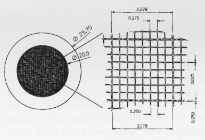 Fig. 5. Entrance window support grid structure
filtered by a triple resistive-capacitive network to produce
less than 0.1% (peak-to-peak) ripple.
The PMT is a ruggedized Hamamatsu R5218 tube
with a 2.8 mm thick quartz entrance window of 76 mm
diameter contained in a mu-metal housing to shield it from
external magnetic fields. Nine anodes, each 13x13 mm 2
are positioned in a 3x3 square configuration with a
separation of 1 mm as shown in Fig. 6. The anodes are
separately read out and operated as an Anger camera (Anger
1958) to provide spatial information. The cathode is a
special bialkali with a spectral response from 160 to 600 nm.
Amplification is provided by 15 proximity mesh dynodes.
Within the FEE, each of the signals from the nine
PMT anodes are fed to separate charge-sensitive amplifiers
with a 60 ms time constant. The amplified signals are
then combined to provide the energy (Sa ), X (Sx) and Y
(Sy) positions and veto (Sz) signals. Defining Ai to be the
output of the i th anode's pre-amplifier, gives:
Sa = å Ai
Sx = A1+A4+A7-A3-A6-A9 + 0.5 Sa
Sy = A1+A2+A3-A7-A8-A9 + 0.5 Sa
Sz = A5
A.N. Parmar et al.: The low-energy concentrator spectrometer
on-board the SAX X-ray astronomy satellite 5
3 +Y
6
9 8
5
2
7
4
1
+X
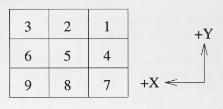 Fig. 6. PMT anode layout. The above view is looking in the
direction of the concentrators through the PMT. The arrows
indicate the spacecraft physical axes
When divided by the S a signal, the veto signal, Sz ,
provides a measure of the light distribution in the detector.
This signal has a high value for events that occur close to
the center of the FOV and a low one for events that occur
outside the FOV. The veto signal can also be used to distinguish
between particle events (which typically appear
extended and therefore have low veto values) and on-axis
X-ray events. The four signals are buffered and passed to
the Electronics Unit (EU) for further processing.
The DU also includes a pressure transducer for monitoring
the cell pressure, a thermistor to monitor the PMT
temperature, two micro-switches to determine the open
and closed position of the shutter mechanism and analog
monitors of the two high voltage outputs.
2.3. Electronics unit
The EU provides the electrical interface between the
instrument and the spacecraft. The main micro-processor is
a radiation-tolerant 80C86 with 64 k-Bytes of data RAM
and 32 k-Bytes of program memory. An additional 32 kBytes
of RAM is available for software updates. A second
processor is dedicated to communications with the
spacecraft using the ESA On-Board Data Handling protocol.
Communication between the two processors is via a dual
port RAM.
The EU performs many functions. The analog signals provided
by the FEE pass through optimized pulse
shapers with a 5.6 ms time constant and
pole-zero cancelation of the FEE's 60 ms
time constant. Additionally,
the energy signal is fed through a 1.5 ms pulse shaper
for burstlength determination. The output of the filters
are sampled at their peaks and the position, veto and
burstlength signals normalized using the energy signal.
At this stage, qualification of the signals occurs, based
on programmable amplitude windows. In the case of a
qualified event, the signals are converted to digital values
using Wilkinson converters which provide good integral
and differential linearity. The measured differential
nonlinearity of the energy channel is 3.5%
of the least significant bit. The energy channel, S a , is converted to a 10
bit value and is referred to as the PHA signal. The other
channels are converted to 8 bit values and are referred to
as the RAWX, RAWY, VETO, and BL signals (coming
from the Sx, Sy, Sz signals and the burstlength
determination circuitry, respectively). Between the time the EU
detects an event and its conversion, the acquisition chain
is inhibited to prevent subsequent pulses from affecting
the current measurement. The time the instrument is inhibited
in this way is accumulated in a deadtime counter.
Whenever a non-qualified event is detected, the analog-todigital
conversion process is aborted in order to minimize
the deadtime. The deadtime for each event is amplitude
dependent, and is in the range 64 ms, for non-qualified
events, to 250 ms for full-scale events.
The on-board software is written in ``C'' with assembler
language used for time critical tasks. The system
runs under the control of a real-time operating system,
which schedules the tasks for instrument monitoring and
protection, command processing and execution, data processing
and packetization. Event processing and telemetry
transmission are interrupt triggered. Whenever a qualified
event is detected, the analog electronics processes the different
signals and converts the analog signals into digital
values as described above. An on-board counter, synchronized to
the spacecraft's ultra-stable clock, time-tags the
event with 16 micro-sec resolution. The complete data set is then
retrieved by the main processor and packetized for transmission
to ground. Alternatively, the event data can be
accumulated by the EU software into images and spectra
in order to conserve telemetry usage.
2.4. Gas unit
The original specification on the leak rate of gas
cell entrance window was sufficiently high to require a gas filling
system. However, the leak rate of the final design is so low
(10
quired for this purpose. The GU was originally designed
to autonomously maintain the gas cell pressure in a
programmable range between 800 and 1200 mbar. However,
this operation is no longer required and it is disabled under
normal operations. Instead, the GU can be used to completely
vent and refill the gas cell should the gas become
contaminated. The unit consists of two identical 0.5 liter
Ti reservoirs containing 20 bar liters of Xe, input and vent
valves, a pressure transducer, a thermistor and the necessary
structure and piping. The non-latching input valve
can be actuated in pulse mode from the EU to allow gas
to enter the cell. The pulse duration is programmable to
minimize the number of actuations. The non-latching vent
valve allows gas to escape from the cell into free space.
The pressure transducer monitors the gas pressure in the
reservoirs.
3. Instrument performance
Great care has been taken to ensure a good calibration of
the LECS. Each of the critical components has been separately
calibrated and then the entire calibration has been
verified at instrument level. The measurements have been
performed using SSD's 6 meter X-ray beam, the Berlin
synchrotron facility (BESSY), and the PANTER longbeam X-ray
facility of the Max Planck Institut für Extraterrestrische
Physik near Munich. All measurements reported here were
performed in vacuum with the nominal
voltages of -20 kV on the cell and 1082 V on the PMT.
Initial functional tests were carried out using SSD's
X-ray beam facility. During these tests, the LECS was
mounted behind a pin-hole plate and illuminated with
Al (1.49 keV) and Fe (6.41 keV) radiation from a source
located 5 meters away. The pin-hole plate consists of a
130 mm thick Ni sheet with 1 mm diameter holes
in a rectangular grid with a 4 mm pitch. Figure 7 shows a
representative image obtained with Fe Kalpha
illumination to illustrate the overall performance
of the LECS. The two 55 Fe
calibration sources are visible in the upper left and lower
right corners. The off-axis pin-hole images are asymmetric
and extended towards the outside of the FOV. This is
caused by the penetration of ~
1.5 keV X-rays into the cell
gas before absorption. Because of the driftless design (see
Sect. 2.2), these penetrating X-rays will give rise to lower
PHA and BL values than those absorbed directly beneath
the entrance window. In addition, the variation in viewing
angle and footprint of the scintillation light will cause the
measured position to be shifted. The dependence of mean
penetration depth on energy under the LECS nominal
operating conditions is shown in Fig. 8.
Table 2. PANTER calibration lines
| Line | Energy | Line | Energy
|
| | (keV) |
| (keV)
|
|---|
| B Kalpha | 0.18 | Ag Lbeta | 3.26
|
| C Kalpha | 0.28 | Ti Kalpha | 4.52
|
| O Kalpha | 0.53 | Ti Kbeta | 4.94
|
| Cu Lalpha | 0.93 | Cr Kalpha | 5.42
|
| Al Kalpha | 1.49 | Fe Kalpha | 6.41
|
| Si Kalpha | 1.74 | Cu Kalpha | 8.06
|
| Ag Lalpha | 3.00 | |
|
The effect of penetration on the LECS event data is
further illustrated in Fig. 9. This shows BL versus
energy for incident X-ray energies just above and just
below the Xe L III edge, where there is a large discontinuity
in mean X-ray absorption depth (see Fig. 8). At an energy
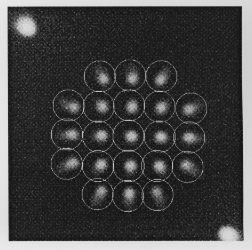 Fig. 7. Multi pin-hole array 6.41 keV image. The calibration
sources are the bright spots in the upper left and lower right
corners. The circles indicate the regions used for gain mapping.
The circular FOV of the LECS is approximately bounded by
the outermost pin-holes
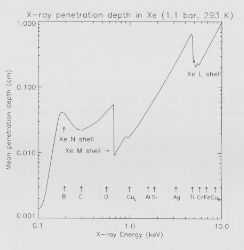 Fig. 8. Mean absorption depth in Xe as a function of X-ray
energy using the absorption coefficients of Henke et al. (1993).
The positions of the Xe absorption edges and the energies of
the lines used in the LECS PANTER calibration are indicated
of 4.77 keV (i.e. just below the Xe L III edge) the
mean penetration depth is large and the extended tail of
events in the upper panel of Fig. 9 towards lower energy
and BL values (1) is caused by penetration. The events
labeled as (2) are due to multiple events occurring within
the EU sampling window i.e. event pile-up. This feature
is prominent due to the high count rates used for these
calibration measurements, but will be negligible for most
astronomical sources. In contrast, the lower panel of Fig. 9
is an exposure at 4.79 keV, i.e. just above the edge.
As expected, the effects of penetration are greatly reduced with
only a small tail towards lower energies and BL values
evident (1). In addition the fraction of escape photons (3)
has increased due to the incident photons having sufficient
energy to liberate electrons from the Xe L III shell.
A further discussion of these effects can be found in Simons &
de Korte (1989) and Bavdaz et al. (1995a).
3.1. Gain temperature dependence
A primary concern is to understand the ``gain'' of the
instrument. This is the relation between the energy of an
event and the mean PHA channel at which it is detected.
The instrument functional tests were performed over a
range of temperatures allowing the temperature dependence
of the instrument performance to be investigated.
The DU thermistor is used as temperature sensor, since
this will be the in-orbit reference.
Each instrument functional test was divided into intervals
of constant temperature and for each of these segments the
average PHA channel of each calibration source
was determined (see Fig. 10). The results from the two
calibration sources only differ by a scaling factor which
probably arises from a small misalignment of the PMT
and gas cell fundamental axes. Both calibration sources
show a linear dependence of gain with temperature in the
range studied. The best-fit coefficient is
can be attributed to the 0.4o C resolution of the
temperature measurement in the region around
25o C. The same procedure
was performed using Fe Kalpha and Al
Kalpha data from within
the FOV to confirm that the temperature dependence is
independent of both position and energy. The temperature
dependence of the gain can be corrected for by defining a
nominal calibration source PHA channel of 410
and normalizing all energy signals to this. If the original energy
channel = PHA, then the corrected channel is given by:
PI = PHA x [(410 + 410) / (cal1 + cal2)]
where cal 1 and cal 2 are the mean PHA channels of the
two calibration sources. Note that the nominal calibration
source channel of 410 is that expected at the predicted
inorbit LECS temperature of 20o C.
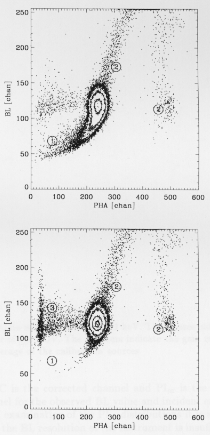 Fig. 9. BL versus PHA channel for 4.77 keV (upper panel)
and 4.79 keV photons (lower panel), i.e. just below and above
the Xe L III edge. See the text for a description of the labels
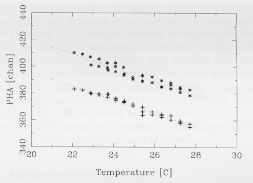 Fig. 10. PHA channel versus temperature for the two 55 Fe
calibration sources. The dotted lines show the best-fit linear
relations
3.2. Gain position dependence
Spatial gain maps were obtained by computing the gain
at each of the pin-hole locations indicated by circles in
Fig. 7. The gain of each image pixel was then estimated
by spline interpolation. Temperature effects were removed
by dividing the data into intervals of constant temperature
and using the average calibration source PHA to normalize
the amplitude of each individual X-ray event according to
Eq.(5). The peak PI channel was determined by fitting
a model consisting of a Gaussian profile plus a constant
background to the data. The interpolated gain maps are
shown in Fig. 11 for Fe Kalpha and
for Al Kalpha X-rays. The
region of maximum gain is offset slightly from the center
of the FOV, probably because of the small misalignment
between the PMT and gas cell fundamental. At the edge of
the FOV the gain is ~95% of the maximum. The two gain
maps only differ by a scaling factor of 0.238, consistent
with the Al/Fe X-ray energy ratio of 0.232 and the energy
discontinuities at the Xe L edges.
Additional multi pin-hole measurements were taken
at the PANTER facility, where other X-ray energies are
available. During this campaign, the pin-hole array was
stepped in the XY plane, parallel to the focal plane,
to increase the spatial sampling. These measurements confirm
the smooth surfaces and extend the calibration to lower
and higher energies. Again, the spatial gain maps are well
behaved, differing only by a scaling factor consistent with
the X-ray energy ratios and detector gas edge discontinuities.
3.3. Penetration correction
Due to the driftless design of the gas cell, X-rays
that penetrate into the cell prior to absorption give rise to events
with lower PI and BL values than events of the same
energy which are detected just beneath the cell entrance
window (see Figs. 9 and 12). In order to correct the observed
PI spectra for this effect, data obtained at the PANTER
facility have been used to determine the mean PI channel
as a function of BL for incident energies 2.9 keV.
(Below this energy there is no worthwhile improvement
in spectral resolution when this correction is applied). For each
line a reference PI channel, PI ref , was determined. This
corresponds approximately to the mean channel of events
absorbed directly beneath the cell entrance window.
In order to determine PI ref for each line, the function described
in Eq.(8) together with a constant background were fit to
the BL spectra and events with BL values greater than
the peak of the distribution selected. A PI spectrum of
these selected events was then accumulated and the same
function fit in order to account for the remaining small
penetration tail. The value of PI ref is then given by the
best-fit value of m. Thus, for a known energy, E c ,
the observed PI spectrum can be corrected for penetration using:
PIC = PIref(Ec) + PI - PIm(BL, Ec)
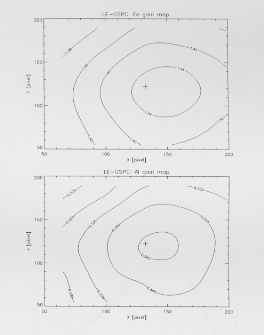 Fig. 11. Gain maps at 1.49 and 6.41 keV. The crosses indicate
the center of the FOV. The numbers indicate the gain relative
to the average of the calibration sources
Here PIC is the corrected channel and PIm is the mean
PI channel for the observed BL value and incident energy.
From an examination of the PIm distributions it is apparent
that the BL resolution of the instrument is insufficient
to fully correct for penetration effects in the energy range
of interest. This explains the remaining small exponential
tail visible in the corrected spectrum in the lower panel of
Fig. 12.
During normal astronomical observations there is a
further complication that the actual energy of a detected
event, E c , is not known a priori and only the probability
that an event has a certain incident energy can be estimated.
In the LECS data analysis software a value of E c
is assigned to each event taking into account this probability.
The penetration correction can then be applied
using Eq.(6). This lack of a priori knowledge of the incident
energy means that e.g. the measured FWHM energy
resolution of 9.0% at Fe Kff (6.41 keV) can only be corrected
to 8.6% using this technique, rather than 8.1% if
the energy of the incident X-rays is known.
3.4. Energy to channel conversion
The overall energy gain of the LECS is expected to be
linear, with discontinuities at the absorption edges of the
detector gas caused by discrete changes in the final ioniza
tion state, and hence the amount of energy retained by the
Xe atoms across the absorption edges. In order to measure
the overall gain, results from the PANTER measurement
campaign were utilized since these covered almost the
entire energy range of the instrument. The lines used and
their energies (Bearden 1967) are given in Table 2. For
each of these lines, the PHA data were first corrected for
the overall temperature and position dependence of the
gain using Eq.(5) and the mean gain map (see Fig. 11).
The resulting spectra, /(PI), can either be represented
by a Gaussian or, at energies ~ 1.5 keV, a Gaussian plus
an exponential low-energy tail. The upper two panels in
Fig. 12 show observed line profiles at 0.28 keV, where the
mean absorption depth is small, and 8.06 keV, where it is
large (see Fig. 8). The 0.28 keV line profile is well fitted by
a Gaussian function, demonstrating the good low-energy
performance of the instrument since the loss of significant
numbers of electrons would result in a tail towards low
energies, which is not evident. The 8.06 keV line shows an
exponential tail extending towards lower energies.
This results from the penetration of X-rays into the gas cell prior
to absorption. The observed line profiles were modeled
using a constant background together with the following
functions:
- For the B, C, O and CuL lines in Table 2 where the
effects of penetration are not evident:
y(PI) =
[C2 / s
(2p)-½]
exp [-(PI - m)2 / 2s2]
- For the other lines in table 2:
y(PI) =
C1 exp( alpha PI)
PI £ vo
y(PI) =
[C2 / s
(2p)-½]
exp [-(PI - m)2 / 2s2]
PI > vo
were vo is the break channel between
the two components, alpha in the e-folding index,
m is the peak PI channel of the Gaussian , sigma is the width of the
Gaussian distribution in standard deviations and C1
and C2 are the normalizations of the
exponential and Gaussian components,
respectively. Since the two components connect smoothly
at v0 , their first derivatives
are equal at this point. (This
implies that vo = m
lines with energies 2.9 keV (below this
energy the PI and PIC channels are equivalent). Eqs.(7)
or (8) were then fit to the PIC spectra, as appropriate, to
derive the best-fit values of m which are used for the PIC
to energy conversion. A linear relation between PIC value
and energy was assumed, allowing for a discontinuity at
the Xe LIII edge at 4.782 keV. The result of this fitting
gives:
PIC = 1:730 + 92:478 ·E E 4:782 keV
PIC = -1:136 + 92:478 ·E E 4:782 keV
The discontinuity at the Xe L edge is 31 eV. This value
is smaller then the 129 eV measured by Bavdaz et al.
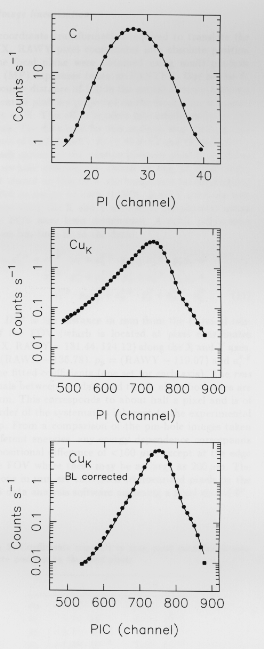 Fig. 12. The response of the LECS to monochromatic radiation
at energies of 0.28 keV (upper panel) and 8.06 keV (center panel).
The statistical uncertainties are comparable to the
symbol size. The ``knee'' visible in the CuK spectra at channel
~850 is from Cu Kbeta radiation. The lower panel shows the effect
of performing the penetration correction described in Sect. 3.3
on the CuK spectrum assuming an incident energy of 8.06 keV
(1995a) using a prototype detector at BESSY. This difference
probably arises because these authors selected only a
small fraction of the available data to minimize penetration
effects. Such a technique cannot be usefully applied
to astronomical measurements. No evidence for a gain
discontinuity at the Xe M edge was found in the PANTER
data.
3.5. Energy resolution
The energy resolution of the LECS was determined at each
of the energies listed in Table 2 using either Eqs.(7) or (8)
and corrected for penetration effects using Eq.(6), as
appropriate. No a priori knowledge of the line energy was
assumed, since this will be the case during astronomical
observations. The full width at half-maximum (FWHM)
of the PIC energy resolution, D E, is related to the width
of the Gaussian distribution by D E = 2:354oe. The LECS
energy resolution is given by:
D E / E = 8.84 (E / (6 keV))-0.42 %
and is shown plotted versus energy in Fig. 13.
The deviation from the expected E-0.5
relation has been previously noted (Simons and de Korte 1989)
and explained as being due to variations in the
footprint of the electron cloud viewed by the PMT.
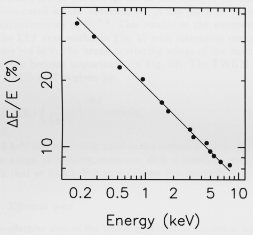 Fig. 13. The LECS penetration corrected energy resolution
versus energy. The best-fit relation given in Eq.(10) is shown
as a solid line. The uncertainties are smaller than the symbol
size
3.6. Image linearization
The coordinate transformation required to translate the
RAWX, RAWY pixel coordinates into absolute position
on the focal plane were obtained using multi pin-hole
mask (MP) exposures taken at PANTER. Due to the finite
source distance of 130 m the actual distance between
consecutive pinholes projected on the focal plane is
magnified by ~1%. This effect is taken into consideration in the
analysis. The data used for this analysis were obtained
using lines of C (0.28 keV), Al (1.49 keV) and Fe (6.41 keV).
For each exposure, the relation between pixel coordinates
and pin-hole position, as shown in Fig. 14, was established.
Based on this data, the coordinate transformation
required to assign to each RAWX, RAWY pixel its true
distance along the X and Y axes from the physical center
of the FOV have been determined. A cubic polynomial
function has been fit to the data:
Dx,y = a0x,y +
a1x,y · px +
a2x,y · py +
a3x,y · pxpy +
a4x,y · px2 +
a5x,y · py2 +
a6x,y · px2py +
a7x,y · pxpy2 +
a8x,y · px3 +
a9x,y · py3
Here, Dx,y is the distance in mm from the physical center
of the FOV (which is located at pixel coordinates
RAWX, RAWY = 131.44, 124.12) along the X and Y axes,
px = (RAWX - 136.78), py = (RAWY - 119.07)
and aix,y are the fitted coeficients
(one set for each axis). The rms residuals between the data and the fit
along both axes are ~60mm;
This corresponds to about half a pixel and is of
the order of the systematics inherent to the experimental
set up. From a comparison of the pin-hole images taken
at different energies, any energy dependence corresponds
to a positional difference of 100
mm, except at the edge
of the FOV where these may be as large as 200 mm. The
positions in mm are converted to linearized pixels by the
LECS data analysis software assuming a pixel size of 8".
Table 3. Coefficients required to map pixel coordinates into
absolute position on the focal plane
| x | y
|
| a0 | -7.00·10-1 | -6.38·10-1
|
|---|
| a1 | 1.24·10-1 | 3.35·10-3
|
|---|
| a2 | -5.71·10-3 | 1.24·10-1
|
|---|
| a3 | -1.98·10-5 | 7.62·10-6
|
|---|
| a4 | 4.16·10-5 | 2.24·10-7
|
|---|
| a5 | 1.42·10-5 | -2.65·10-5
|
|---|
| a6 | 8.24·10-8 | 2.02·10-6
|
|---|
| a7 | 1.99·10-6 | -4.92·10-7
|
|---|
| a8 | 1.45·10-6 | -8.69·10-8
|
|---|
| a9 | 1.36·10-7 | 2.04·10-6
|
|---|
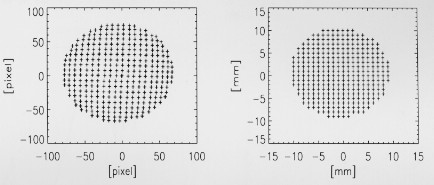 Fig. 14. Correspondence between px , py pixels
(left panel) and physical space (right panel).
Each data point represents the
position of one pinhole
3.7. Encircled energy function
The overall encircled energy function (EEF) of the LECS
is a convolution of those of the MU and detector
modulated by the obscuration of the entrance window
strongback and support grid. Its shape can therefore
not be easily parameterized in a similar manner to that of the MECS
(Boella et al. 1996a). Measured, azimuthally averaged,
onaxis EEFs are shown in Fig. 15. At low energies the EEF
is dominated by the contribution of the detector, which
is approximately / E :5 . This results in the narrowing
of the EEF core visible in Fig. 15 with increasing energy.
Above ~4 keV, the broad scattering wings of the mirror
response become important (see Fig. 19). The FWHM of
the LECS EEF is given by:
EEF = 2.1 ( E / (6 keV) )-0.5 arcmin
At 6keV this relation is valid in the central 8' of the FOV.
The range of validity increases with decreasing energy;
such that at 0.28 keV it is valid over the entire FOV.
3.8. Effective area
The effective area of the LECS is primarily limited
at lowenergies by the transmission of the entrance window and
at high-energies by the loss in reflectivity of the MU. The
predicted on-axis effective area of the LECS is shown in
Fig. 16. This figure includes the theoretical mirror
efficiency (Sacco 1995, private comm.), detector absorption
efficiency and plasma grid transmission and the measured
entrance and plasma protection window transmissions. A
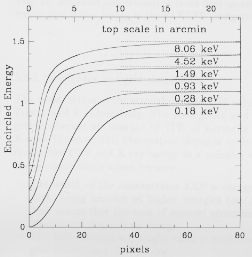 Fig. 15. Measured, azimuthally averaged, on-axis LECS
encircled energy functions at various energies. Each plot has been
offset from the next by 0.1 for clarity. The dotted lines show
the asymptotic values
constant geometric obscuration due to the window support
structure of 17% is assumed. The large change in effective
area at 0.28 keV is due to the C K-edge. The effect
of the K-edges of N, O, and Al, which are all constituents
of the windows, are also visible. The structure between
2-4 keV is caused by the M-edges of the Au mirror material.
At the edge of the FOV (i.e. an offset angle of 18 0 ), the
effective area of the LECS is 0.4 times that on-axis.
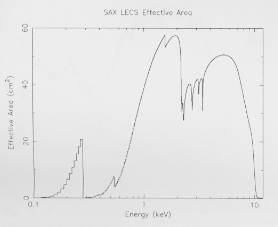 Fig. 16. Predicted LECS on-axis effective area
3.8.1. Mirror effective area
In the PANTER configuration the effective mirror collecting
area is reduced to 97.3 cm 2 , including obscuration by
the mirror spider (Conti et al. 1994). The MU effective
area was measured at each of the energies listed in
Table 2 (except that the measurements for the two Ag and
Ti lines were combined, and an additional P (2.01 keV)
measurement was included). The MU effective area was
derived by comparing the count rate with the MU in place
to that during a flat-field exposure (i.e. with the MU removed).
The derived values were corrected for the effects
of strongback and fine grid obscuration and deadtime and
are shown plotted in Fig. 17. This figure also shows the
theoretical MU response derived from ray-tracing simulations
of a source at the same distance as that at PANTER.
The agreement between measurement and theory is good
except at low energies (the B and C measurements at 0.18
and 0.28 keV) where the measured areas are a factor ~1.5
too high. Such an effect may be related to the location of
the LECS in the PANTER chamber and the complicated
behavior of the MU to off-axis X-rays. In particular,
X-rays from within a 2o offset angle which are reflected by
either one of the first or second mirror cones only, can
reach the focal plane. In addition, for particular offset
angles, X-rays can reach the focal plane without reflection
(Conti et al. 1994). Thus, it is possible that low-energy
X-rays scattered off the chamber walls during the mirror
exposures enter the detector, resulting in the anomalous
area measurements. An additional effect may be due to
molecular contamination of the mirror surfaces
(e.g., Elsner et al. 1994). However, there is no totally convincing
explanation for this phenomenon and we await the results
of in-flight measurements to verify the low-energy LECS
effective area.
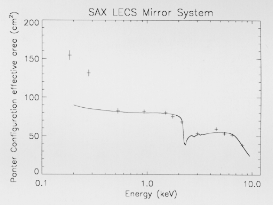 Fig. 17. Measured and theoretical (solid line)
on-axis MU effective area versus energy in the PANTER configuration
3.8.2. Strongback and grid obscuration
The construction of the strongback and grid are shown in
Figs. 4 and 5, respectively. The strongback and grid
together obscure an average of 17% of normally incident
X-rays. However, this obscuration depends on both position
in the FOV and X-ray energy in a complex way. The
energy dependence arises because:
- The width of the concentrator EEF is energy dependent,
being broader at higher energies (see Fig. 19).
This means that the area of support structure that is
illuminated depends on energy.
- The finite strongback height casts a shadow onto the
grid for incident X-rays that do not arrive normally.
Since the average X-ray incidence angle is energy dependent,
this effect is also energy dependent.
The effect of strongback and fine grid obscuration is
illustrated in Fig. 18 which shows the LECS counting rate
at 0.28 keV during a 3.9 mm long scan of the central region
of the detector in a direction parallel to the Y axis, using a
constant intensity X-ray beam. The two large (~25%) decreases
in count rate delineate the 2.2 mm central strongback square
and are caused by the strongback ribs. A
smaller amplitude (~5%) modulation due to the fine grid
is also visible. The overall trend of increasing count rate
with distance along the Y axis is probably due to a small
misalignment between the mirror and detector units.
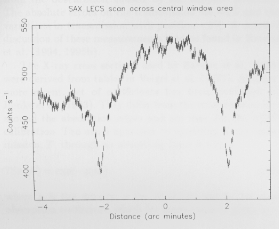 Fig. 18. A scan across the central part of the LECS window
centered on 0.28 keV showing the effects of strongback and fine
grid obscuration. The distance scale indicates the approximate
angular distance from the center of the FOV
These obscuration effects are treated by means of a
Monte-Carlo simulation in the LECS data analysis system. The
first stage of this process is a ray-tracing model
of the mirror system. This is based on the commercial
ray tracing software package, IRT, from Parsec Technology Inc.
which has been ``tuned'' to give good agreement
with the mirror EEF's obtained at the PANTER facility
using the flight MU and the ROSAT Position Sensitive
Proportional Counter (PSPC) as a focal plane detector.
The spatial resolution of the PSPC is much better than
that of the LECS, and is sufficient to allow the intrinsic
shape of the MU EEF to be reliably determined. Fig. 19
shows the good agreement between observed MU EEFs
and those predicted by the ray-tracing model.
A geometric model of the support structure and the
fine grid is then used to determine the fate of an X-ray
with given energy and arrival direction. X-rays which exit
the MU can reach the entrance window undisturbed, or be
absorbed in the fine grid, or interact with the strongback.
In the latter case, the photon can be either absorbed or
reflected, with a probability that depends on the energy
and the angle of incidence with the strongback. Reflected
photons may be absorbed by the fine grid. Using the processes
described above, it is possible to generate the EEF
of the concentrators for any given energy and position in
the FOV and to propagate this through the support structure.
The effect of this obscuration on the analysis of both
extended and variable sources will be evaluated during the
Science Verification Phase of the mission.
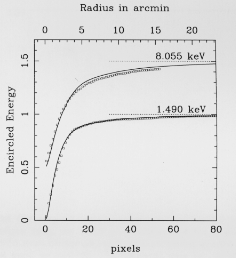 Fig. 19. Azimuthally averaged mirror unit
EEFs at two energies obtained by ray-tracing (squares)
and measured using
the ROSAT PSPC at two energies (solid lines). The plots have
been offset by 0.5 units for clarity. The dotted lines show the
asymptotic values
3.8.3. Entrance window X-ray transmission
The primary goal of the LECS is to perform low-energy
spectroscopy. Since the low-energy response of the detector
is primarily defined by the transmission of the entrance
window, a well calibrated window transmission is vital.
With this in mind, great care was taken to determine the
window transmission paying particular attention to variations
near the edges of the constituent materials and to
the position dependence of the overall transmission.
Measurements using the available lines at PANTER
(Table 2) are inadequate for this purpose, and instead
a thorough investigative campaign was performed at
BESSY. The PTB SX-700 plane grating monochromator beamline
was used which provided energy resolution,
E/D E, of between 5000 at 0.06 keV to 400 at 1.8 keV,
scaling as E :5 . Since the entrance window is highly
transparent at energies ~ 2 keV,
measurements were only made in
the energy range 0.1 to 1.8 keV. Transmissions at 500
energy values were measured at five positions in the central
window area. Energy steps as small as 0.2 eV were used
around the absorption edges of the constituents. These
measurements were complemented by a series of measurements
in the center of each of the 8 by 8 fine grid positions in
the central 3 by 3 central strongback squares (see
Fig. 4). Between 18 and 30 energies were used for these
scans. The 99% flux width of the beam was ~180 mm,
smaller than the fine grid mesh size. This allowed the
transmission of the window to be measured separately
from the obscuration caused by the support structure.
The absolute errors on the transmission are ~1% and the
variations in transmission with position
3%. A detailed
discussion of these measurements is to be found in Bavdaz
et al. (1994, 1995b).
The X-ray cross sections used by Bavdaz et al. (1994)
were derived from tables in Veigel et al. (1971). Another,
more recent, set of coefficients has been published by
Henke et al. (1993). They differ from the older ones mainly
around the absorption edges and are used for the LECS
calibration. The usual approach to modeling X-ray
transmission, T , through an absorbing layer is to use:
T (x,E) = exp( - m rx )
where r is the density, x the thickness
and m the mass absorption coefficient; which
for compounds is given by:
m = å
mifi
where mi is the mass
absorption coefficient of element i
and fi its fractional weight. By defining ai as the area
density of element i, we can write:
å = mifi
rx = å mi rix =
å miai
Using the measurements at different energies, gives the
area densities required to describe the X-ray transmission
properties of the window. Unfortunately the chemical
state and thickness of the absorber change the edge
absorption characteristics e.g., Bearden & Burr (1967) and
Owens et al. (1996) and Eq.(14) is only a good approximation
away from the edges. As an example, Fig. 20 shows
the actual transmission around the O K edge compared to
the Veigel et al. (1971) (solid line) and Henke et al. (1993)
mass absorption coefficients (dashed line).
In order to precisely model the LECS window transmission,
the following empirical function has been used:
T = exp( - å miai ) x Tc
where the correction factor, Tc, is defined as the ratio of the
measured data to that predicted using the Henke et al. (1993) coefficients
outside the edge regions:
Tc = Tdata / exp ( -
å miai )
The correction factor is derived from the average of the
five high resolution energy scans and is plotted in Fig. 21.
As expected, it has a value close to one (i.e. no correction)
away from the edges of constituent materials and above
1.8 keV.
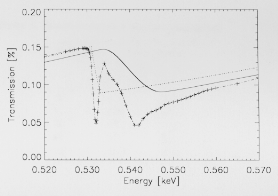 Fig. 20. Entrance window transmission around the O K edge.
Predictions using the Veigel et al. (1971) and the Henke et
al. (1993) mass absorption coefficients are shown as solid and
dashed lines, respectively. The measured data are shown as
crosses
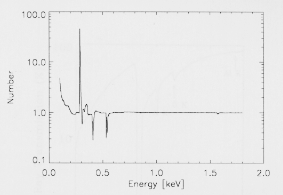 Fig. 21. The correction factor used to model the transmission
of the entrance window around the absorption edges
The area densities for each of the window constituents
were fit at each position by minimizing the parameter, Q:
Q º å( Tjdata -
Tjexp )2
Tjexp = exp( -
å mjkak )
where the index ``j'' denotes the energy dependence and
``k'' the window constituents of H, C, N, O, and Al.
Energy regions close to the absorption edges were excluded.
Table 4 summarizes the theoretical composition, based on
the design shown in Fig. 3. Figure 22 shows the measured
transmission of the entrance window and compares it with
a 10 mm thick Be window
as used on the ASCA GSPC
(Tanaka et al. 1994). The derived area densities are given
in Table 5. The fitted curve matches the data well, but
is not superposed for clarity. The complex structure near
the edges is clearly visible.
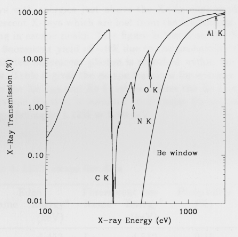 Fig. 22. The measured transmission of the LECS entrance
window at one position. Absorption edges of the constituent
materials are indicated. The theoretical transmission of a
10 mm Be window
is also shown for comparison
Table 4. Nominal entrance window composition
| Material | Area density | Thickness
|
| | (mg cm-2) | (mm)
|
|---|
| Polyimide | 175 | 1.25
|
| AlN | 11.4 | 0.035
|
| Al | 11.9 | 0.044
|
3.8.4. Plasma protection window X-ray transmission
The transmission of the plasma protection window was
also measured at BESSY. A high resolution energy scan
(500 energy measurements between 0.1 and 1.8 keV) at
the center of the window and a high position resolution
scan at 3 energies (0.27, 0.90 and 1.55 keV) were performed.
The scan revealed 1% rms spatial variations
in transmission. Since this window is located 5 cm above
Table 5. Measured entrance window composition
| Element | Area density |
| (mg cm) |
|---|
| | nominal | measured
|
| H | 4.8 | 4.9
|
| C | 126 | 130
|
| N | 17.3 | 17.1
|
| O | 31 | 38
|
| Al | 19.4 | 12.8
|
the focal plane, any small transmission variations will be smoothed out and we
therefore assume a uniform absorption with position. The absorption of the window
has been modeled in a similar manner to that of the entrance window,
except that the effect of the support grid is included.
The resulting function is plotted in Fig. 23.
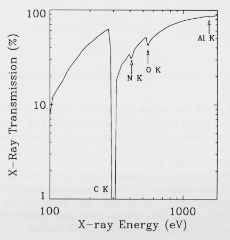 Fig. 23. The measured transmission of the plasma protection
window and strongback. Absorption edges of the constituent
materials are indicated
3.8.5. Detector absorption efficiency
Nearly all incident X-rays with energies in the range 0.1-10
keV that pass through the entrance window are absorbed in the
5 cm deep LECS gas cell. The absorption
efficiency decreases slightly at the upper end of the energy
range, being 0.996 at 10 keV. Following photo-electric
absorption an excited ion may relax by the emission of an
Auger electron or a fluorescent photon. The probability
that a fluorescent photon will escape from the detection
volume is geometry dependent, and has been measured for
the LECS using data obtained at BESSY and PANTER.
The values given in Table 6 have been adopted for use
in the LECS calibration and show that 1.68% of incident
X-rays with energies just above the Xe L I edge produce
fluorescent X-rays which are lost from the instrument,
resulting in escape peaks. This figure is less than the Xe L
shell fluorescent yield of ~8% due to the probability that
an emitted fluorescent photon is absorbed within the detector.
Table 6 gives the escape fractions for energies between the
Xe L III and Xe L I edges. Above the Xe L I edge
the escape fraction is assumed to decrease linearly with
energy, falling to 1.12% at 8.06 keV.
Table 6. LECS escape line data
| Edge | Fluorescent line | Probability |
| Name Energya | Name Energyb | (%) |
| | (keV) | | (keV) |
|
| L I | 5.453 | Lbeta 3 | 4.512 | 0.15
|
| L II | 5.104 | Lgamma 1 | 5.036 | 0.02
|
| | | Lbeta 1 | 4.422 | 0.46
|
| L III | 4.782 | Lbeta 2 | 44.72 | 0.12
|
| | | Lalpha 1 | 4.111 | 0.93
|
aBearden & Burr (1967), b Bearden (1967) |
3.9. Background counting rate
The VETO and BL signals can be used to minimize the
residual background counting rate seen in the LECS. The
definition of these signals is given in Sects. 2.2 and 2.3.
Briefly, the VETO signal is a measure of the fraction of
the total light collected by the central anode of the PMT
(see Fig. 6) and, in general, an on-axis event will have
a higher value than an off-axis or extended event. The
BL signal is a measure of the duration of scintillation of
an event and will, on average, be shorter for events that
penetrate into the detector prior to absorption.
Figure 24 shows BL plotted against VETO for on-axis
B (0.18 keV) and CuK (8.06 keV) events. Events falling
outside the FOV are excluded. The events with VETO
values of ~20 result from multiple calibration source events
being detected during a single EU sampling window. The
effects of penetration are clearly seen in the CuK image,
where a tail towards lower BL and higher VETO values
is evident. This change in VETO value is caused by the
increased PMT viewing angle of penetrating events which
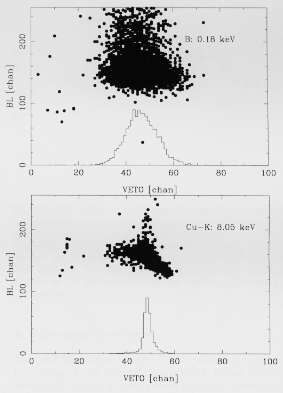 Fig. 24. BL plotted against VETO at two energies
are absorbed closer to the central anode (see Fig. 6 and
Eq.(4)). At 0.18 keV, because of low signal strength, the
BL signal distribution is significantly broadened by the
EU circuitry. In addition, at low energies there is an
unexpectantly large number of events with high BL values.
The magnitude of this effect appears to be inversely
correlated with mean absorption depth. It is possible that these
events are absorbed very close to the entrance window
where the electric field is non-uniform due to the
undulating window surface. Figure 25 shows an optical image of
part of an entrance window foil and illustrates the irregular
nature of the foil in each of the 250 by 250
mm squares
which correspond to the gridlets of the window support
grid (see Fig. 5).
Figure 26 shows the allowed range of BL plotted
against PI energy channel for a 90% X-ray acceptance as
a hatched area. The broadening of the BL distribution at
low-energies discussed above is visible, as is the effect of
change in mean absorption depth around the Xe L edge at
a PI channel of ~400. This figure has been obtained using
PANTER data for the lines shown in Table 2 (except that
the results for the Ag Lalpha and Lbeta
and Ti Kalpha and Kbeta lines
have been combined) and by making a series of ``box cuts''
centered on the calibration energies.
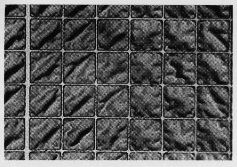 Fig. 25. An optical image of part of an entrance window foil
showing the irregular nature of the foil in each of 250 by 250
mm
gridlets. The lightly colored thin lines show the location of part
of the window support grid. Part of a strongback rib is located
over the thicker line
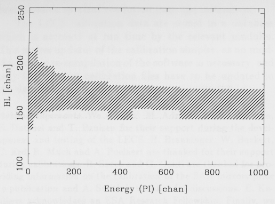 Fig. 26. The allowed BL range for 90% X-ray acceptance
efficiency shown as a hatched region
The LECS background counting rate within the FOV
has been estimated using a 3:6 \Delta 10 5 s exposure taken
in SSD's X-ray beam. A VETO acceptance interval of
30 to 65 combined with BL cuts of the type described
above were applied to the data to give count rates of
1.6·10-3cm-2s-1keV-1 for 90% X-ray acceptance and
1.8·10-3cm-2s-1keV-1 for 90% X-ray acceptance.
(Note that the cm-2 in the count rate units refers to the window area).
Figure 27 shows the effect of these selections.
The increase in counts observed in the incident
spectrum around PI channel 600 is primarily due to event
pile up from the calibration sources. As Fig. 27 illustrates,
these events are efficiently removed by the VETO selection.
At the lowest PI channels there is an increase in
detected event rate which is probably due to electronic
noise. The EU analog thresholds were modified following
the PANTER calibration and this effect is not expected
to occur in space.
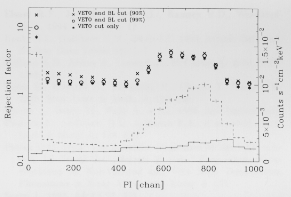 Fig. 27. The effect of VETO and BL selection on the
laboratory background spectrum within the FOV. The observed
spectrum is shown as a dashed histogram and the spectrum
remaining following selection as a solid histogram. 1oe
uncertainties are indicated. The count rate scale is given by the
right ordinate. The efficacy of each of the selection techniques
is given by the left ordinate. See the text for a description of
the spectra
4. Data analysis software
The SAX Operations Control Center will not perform any
processing of the scientific data which means that observers
will receive a time-ordered telemetry stream separated into
event and housekeeping data for each interval of
contiguous instrument configuration and spacecraft pointing.
In addition, auxiliary data such as the geomagnetic
cutoff rigidity and the angle of the instrument's pointing
axis with respect to the Earth's limb are not present on
SAX data tapes and have to be calculated if they are to
be used for data screening. Since the event files cannot be
directly read into any of the major data reduction packages
currently in use by the astronomical community, a
dedicated LECS software package has been developed by
SSD which will be made available to observers through
the SAX operations center in Rome.
The LECS software allows the following steps to be
performed:
- Conversion of the event and housekeeping telemetry
files into a set of FITS format files, following the
conventions which are becoming a de facto standard in
the astronomical community.
- Generation of auxiliary quantities data.
- Monitoring of relevant housekeeping parameters.
- Determination of the gain of the two calibration
sources.
- Selection of the ``good'' events and time intervals and
rejection of background events, based on criteria such
as VETO and BL ranges, position in the FOV, Earth
limb angle, etc.
- Conversion from raw PHA channels to PI channels for
each event using the gain of the two calibration sources
as input (see Sect. 3.1).
- Linearization of event positions using the calibration
data (see Sect. 3.6) and conversion to sky coordinates.
- Extraction of images, spectra and light curves for
subsequent scientific analysis.
- Generation of the detector response matrix for the
source being analyzed, using as input the extracted
spectrum and relevant calibration data.
Two options are available in the LECS data analysis
system to correct the PI data for the effects of penetration.
The first is to leave the observed spectra uncorrected
i.e. with non-Gaussian tails at energies where the
penetration depth is significant (see Fig. 12) and to generate the
appropriate detector response matrix incorporating this
effect. The second option is to correct the PI data based
on event BL as described in Sect. 3.3 and so obtain the
best possible spectral resolution from the instrument.
The LECS calibration data are stored in a database
which is accessed at run time by the relevant modules.
This makes updates of the calibration simpler, as no modification
or re-compilation of the software is necessary, and
only the relevant calibration files have to be updated in
the database.
Acknowledgements
We thank M. Adriaens, S. Andersson,
E. Dutruel and T. Paulsen for their support during the
development and testing of the LECS. H. Brauninger, W. Burkert,
C. Erd, R. Much and A. Poelaert are thanked for their support
during calibrations. B. Sacco and G. Conti are thanked for
providing information on the calibration of the SAX mirrors prior
to publication and A. Smith is thanked for discussions. E.
Kuulkers acknowledges an ESA Research Fellowship. Finally, we
thank the ASI Space Segment project manager, R.C. Butler,
for his tireless efforts on behalf of SAX.
References
- Anger H.O. 1958, Rev. Sci. Instr. 29, 27
- Bavdaz M., Martin D.D., Peacock A. 1995a, SPIE 2517, 465
- Bavdaz M., Peacock A., Fuchs D., et al., 1995b, Rev. Sci. Instrum. 66 (3), 2570
- Bavdaz M., Peacock A., Parmar A.N., et al., 1994, Nucl. Inst. & Meth. A, 345, 549
- Bearden J.A. 1967, Rev. Mod. Phys. 39, 78
- Bearden J.A., Burr A.F. 1967, Rev. Mod. Phys. 39, 125
- Bignami G.F., Villa G.E., Boella G., et al., 1990, SPIE 1344, 144
- Boella G., Chiappetti L., Conti G., et al., 1996a, this volume
- Boella G., Butler R.C., Perola G.C., et al., 1996b, this volume
- Butler R.C., Scarsi L. 1990, SPIE 1344, 46
- Citterio O., Conti G., Mattaini E., Sacco B., Santambrogio E. 1985, SPIE 597, 102
- Conti G., Mattaini E., Santambrogio E.B., et al., 1994, SPIE 2279, 101
- Davelaar J., Manzo G., Peacock A., Taylor B.G., Bleeker J.A.M. 1980, IEEE Trans. Nucl. Sci. NS-27, 196
- Elsner R.F., Joy M., O'Dell S.L., Ramsey B.D., Weisskopf M.C., 1994, SPIE 2279, 12
- Henke B.L., Gullikson E.M., Davis J.C. 1993, Atomic Data and Nuclear Data Tables 54(2), 1
- Holland A.D., Abbey A., Lumb D.H., McCarthy K. 1990, SPIE 1344, 386
- Inoue H., Koyama K., Matsuoka M., Ohashi T., Tanaka Y. 1978, Nucl. Instr. & Meth. A, 157, 295
- Owens A., Denby M., Wells A., et al., 1996, ApJ (submitted)
- Peacock A., Andresen, R.D., Leimann E.A., et al., 1980, Nucl. Instr. & Meth. A, 169, 613
- Perola G.C. 1983, The Scientific Objectives of the SAX mission. In: Perola G.C., Salvati M. (eds.) Proceedings of the Workshop on Non-thermal and Very High Temperature Phenomena in X-ray Astronomy. Rome, p. 175
- Scarsi L. 1993, A&AS 97, 371
- Simons D.G., de Korte P.A.J. 1989, Nucl. Inst. & Methods A, 277, 642
- Simons D.G., de Korte P.A.J., Peacock A., Bleeker J.A.M. 1985, SPIE 597, 190
- Spada G.F.L. 1983, SAX Scientific Instrumentation. In: Perola G.C., Salvati M. (eds.) Proceedings of the Workshop on Non-thermal and Very High Temperature Phenomena in X-ray Astronomy. Rome, p. 217
- Swank J.H., Jahoda K., Zhang W., et al., 1995, The X-ray Timing Explorer: Progress and Science Prospects. In: Alpar M.A., Kizilo–glu ¨
U, van Paradijs, J. (eds.) The Lives of the Neutron Stars. NATO ASI Series C, 450, 523
- Tanaka Y., Inoue H., Holt S.S. 1994, PASJ 46, L37
- Trümper J. 1983, Adv. Space Res. 2, 241
- Veigel W.M.J., Briggs E., Bates L., et al., 1971, X-ray Cross Section Compilation from 0.1 keV to 1 MeV. Technical Report 2433F, Kaman Science Corporation, Colorado Springs, Co, USA
- Weisskopf M.C. 1987, Ap. Lett. Comm. 26, 1
- Wells A.A., Stewart G.C., Turner M.J.L., et al., 1992, SPIE 1574, 205
