XISSIM: Mapping the XIS FOV on the sky
To begin with, you need to determine the Suzaku pointing for a simulation. The region file generator aemkreg visualizes the XIS and HXD FOVs in the sky image on ds9 by calculating the FOV region for a Suzaku attitude. The Suzaku attitude is defined with Z-Y-Z Euler angles, where the Z-axis is the pointing direction. Therefore, (Euler1, 90.0-Euler2) is the equatorial coordinates of the pointing direction, and (90-Euler3) gives the satellite roll angle that is measured from North to DETY axis counter-clockwise (see the configuration of the XISs). For most purposes, the roll angle is not essential for the simulation so an arbitrary angle can be given as the third Euler angle.
To put your target at the center of the XIS FOV, type
aemkreg "[Source RA]" "90.0-[Source Dec]" "[90.0-Roll angle]" > "region file name"
You can see the XIS FOV on a sky image on ds9 by loading this region file, regionfile.reg.
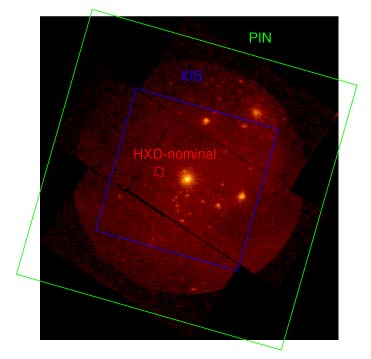
Let's take an example of a Suzaku observation of Eta Carinae Although Suzaku has already observed Eta Carinae and the data are public, we here assume that we plan a Suzaku observation of Eta Carinae and decide the best XIS field of view from the XMM-Newton MOS image (ID112580601, see the image below). In this observation, we put Eta Carinae at (R.A., Dec)(2000) = (161.2650, -59.6845) at the center of the XIS field of view (i.e. XIS nominal position). while we choose the roll angle at -16 degree to include the two bright sources at the best position. Then, you type on the UNIX command line
aemkreg 161.2650 149.6845 106 > etacar_xishxd.reg
After loading the region file etacar_xishxd.reg on ds9, you can see the XIS FOV and the HXD PIN FOV on the MOS image like below. The generated source region is this. You can also see the FOV of GSO on a bigger image.
NEXT: Faking incident photons with mkphlist
UP: Xissim top page
If you have any questions concerning Suzaku, visit the Feedback form.


