For Educators
Spectroscopy
By J. Allie Hajian & Maggie Masetti
Spectroscopy is a complex art - but it can be very useful in helping scientists understand how an object like a black hole, neutron star, or active galaxy is producing light, how fast it is moving, and even what elements it is made of. A spectrum is simply a chart or a graph that shows the intensity of light being emitted over a range of eneriges. Spectra can be produced for any energy of light - from low-energy radio waves to very high-energy gamma-rays.
Spectra are complex because each spectrum holds a wide variety of information. For instance, there are many different mechanisms by which an object, like a star, can produce light - or using the technical term for light, electromagnetic radiation. Each of these mechanisms has a characteristic spectrum.
Let's look at a spectrum and examine each part of it.

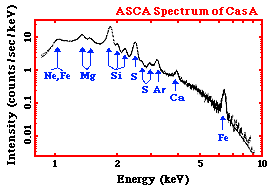
Above is an X-ray spectrum made using data from the ASCA satellite. It is of a supernova remnant (SNR) - a SNR is a huge cloud of gaseous matter swept up from the explosion of a massive star. The X-axis shows the range of energy of light that is being emitted. The Y-axis of the graph shows the intensity of the light being emitted by the SNR - that is, how many photons of light the SNR is giving off at each energy. We can tell that the light, or radiation, from this SNR is very high energy - if we look at the units of the X-axis - we can see that the photons of light have energys measured in keV, or kilo-electron Volts. A kilo-electron Volt is 1000 electron Volts (eV). This puts is the X-ray range of the electromagnetic spectrum.
The graph shows a decreasing curve, with lots of bumps in it. The curve itself is called a continuum - it represents X-ray photons emitted at all energies continuously. The X-rays that are producing this continuum can be caused by several mechanism that are completely different than those producing the X-rays at the various peaks and bumps on the curve. The peaks and bumps are called line emission. Not only are these two different kind of X-ray emission (continuum and line) produced differently, but they each tell us different things about the source that is emitting them.
The Electromagnetic Spectrum
White light (what we call visible or optical light) can be split up into its constituent colors easily and with a familiar result - the rainbow. All we have to do is use a slit to focus a narrow beam of the light at a prism. This set-up is actually a basic spectrometer.

The resultant rainbow is really a continous spectrum that shows us the different energies light (from red to blue) present in visible light. But the electromagnetic spectrum encompasses more than just optical light - it covers all energies of light extending from low-energy radio waves, to microwaves, to infrared, to optical light, to ultraviolet, to very high-energy X- and gamma-rays.
On the next few pages, we'll go into more detail about line and continuum emission - what mechanisms cause them, and what they can tell us about the light-emitting object. But first, to understand the ways in which energy is converted into light, we have to understand how the atom works.
- Spectroscopy
- Next: Understanding Atoms
- Line Emission
- Continuum Emission
- Pulling It Together


