The vital statistics of the four XRT combined are:
The XRT (Serlemitsos et al. 1995), which comprise four X-ray telescopes, are attached to the top plate of the Extensible Optical Bench (EOB). Each of the four telescopes is located opposite one of the two SIS and two GIS spectrometers which are located at the telescope foci. Each telescope is equipped with a thermal shield that transmits X-rays. After launch, the EOB extended and a sun-shield unfolded to prevent sunlight from shining directly into the telescopes. The focal length is 3.5 m. The components of ASCA in flight are shown in Figure 5.2a The sunlight comes perpendicularly to the page from the back. A detailed picture of the four X-ray telescopes attached to the top plate of the EOB is shown in Figure 5.2b.
Note that the four focal-plane instruments are designated SIS0, SIS1, GIS2 and GIS3.
Figure 5.2b also shows the basic design of the XRT: 120 very thin
aluminum foils 125 ![]() m thick are nested together in concentric
circles at a pitch of about 1 mm and are mounted in quadrants with
metal fittings. The reflecting surface is a
10-20
m thick are nested together in concentric
circles at a pitch of about 1 mm and are mounted in quadrants with
metal fittings. The reflecting surface is a
10-20 ![]() m layer of acrylic vacuum-coated with 60 nm of gold.
This configuration uses more than half the telescope aperture and
allows grazing angles of 0.5 arcmin. The Half-Power-Diameter of the
XRT is 2.9 arcmin--due mostly to the fact that foils cannot be
polished rather than the conical approximation which would yield an
HPD of 20 arcsec.
m layer of acrylic vacuum-coated with 60 nm of gold.
This configuration uses more than half the telescope aperture and
allows grazing angles of 0.5 arcmin. The Half-Power-Diameter of the
XRT is 2.9 arcmin--due mostly to the fact that foils cannot be
polished rather than the conical approximation which would yield an
HPD of 20 arcsec.
Note that the XRT are not equipped with pre-collimators. This means that photons from outside the field of view of the XRT can enter and be reflected off one set of mirrors to appear in the fields of view of the GIS and SIS. Thus, bright sources just outside the field of view may contaminate one's observation.
The effective area of one XRT is shown in Figure 5.3a. The data are derived from pre-flight calibration. The absorption features between 2-4 keV are the M edges of gold, the reflecting surface of the mirrors. The figure also shows the strong vignetting and the azimuthal dependence of the effective area.
The field of view of the XRT is larger than the fields of view of the GIS (circular: 50 arcmin in diameter) and the SIS (22 arcmin square). Thirty arcmin off center the flux is 10-20 per cent (depending on energy) of the on-center value. This is shown in Figure 5.3b which shows the effective area as a function of off-axis angle. The FWHM at 1 keV is 24 arcmin.
In the focal plane of the XRT, 1 mm corresponds to ![]() arcmin
(actually, 0.9822 arcmin).
arcmin
(actually, 0.9822 arcmin).
The spatial resolution of the XRT depends in a complex way on off-axis angle and azimuthal angle. Neglecting, at first, the azimuthal dependence (by averaging it out), the resolving power of the telescopes is illustrated in Figure 5.3c which shows the on-axis point spread function (PSF). The PSF gives the probability of detecting a photon as a function of the distance from its original position on the sky. In general, the XRT has rather poor angular resolution compared with previous X-ray telescopes. However, the strongly peaked PSF allows some improvement by using image reconstruction techniques.
Note that the GIS also has an intrinsic PSF which is also shown in Figure 5.3c . The intrinsic PSF of the SIS can be neglected.
The quadrant design of the telescopes imposes a characteristic Maltese cross profile on the azimuthal dependence of the PSF. Figures 5.3d & 5.3e show this effect, as well as the effect on the PSF of moving off axis. The distortion of the Maltese cross and the disappearance of one set of lobes with increasing off-axis angle are due to shadowing by the mirror foils and their supports. Figure 5.3f shows real data from Cyg X-1, illustrating the effects of the XRT and GIS PSFs.
Further information can be found in the following references.
Serlemitosos, P. J. et al. 1995, "The X-ray Telescope with ASCA", Publ. Astron. Soc. Japan, 47, 105
Tsusaka, Y. et al. 1994 "Calibration of Astro-D telescope with an x-ray pencil beam", SPIE, 2011,517
Tsusaka, Y. et al. 1995, "Characterization of the Advanced Satellite for Cosmology and Astrophysics x-ray telescope: preflight calibration and ray tracing", Applied Optics, 34, 22
Figure 5.2a: The components of ASCA on orbit. The sunlight comes perpendicularly to the page from the back. The figure shows the Sun Shield, the four XRT and four focal-plane instruments (two GIS, two SIS).
Figure 5.2b: A detailed picture of the four X-ray telescopes attached to the top plate of the Extensible Optical Bench. Note the quadrant design and the nested thin foils.
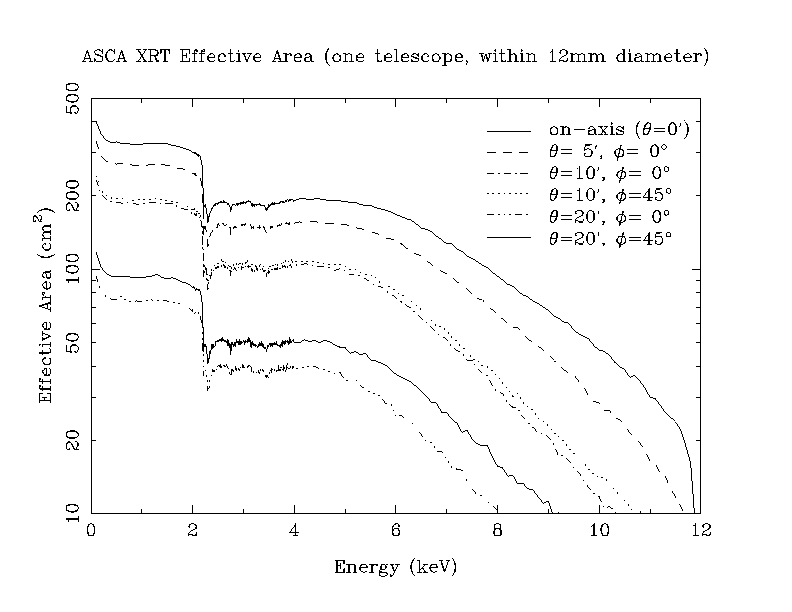
Figure 5.3a: The effective area of one XRT, as derived from in-flight calibration The absorption features between 2-4 keV are the M edges of gold, the reflecting surface of the mirrors. Also shown is the dependence of the effective are on off-axis angle and on azimuthal angle.
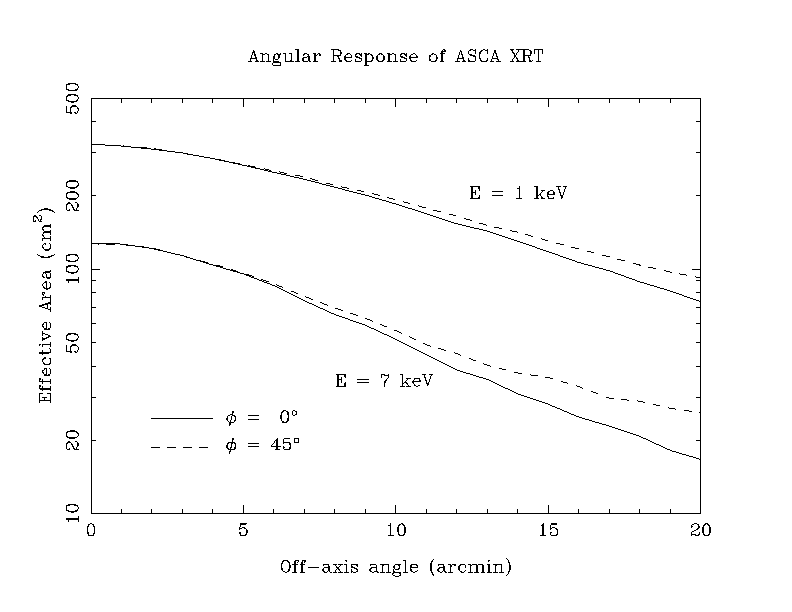
Figure 5.3b: The diminution of XRT effective area as a function of off-axis angle for two energies, 1 keV and 7 keV.
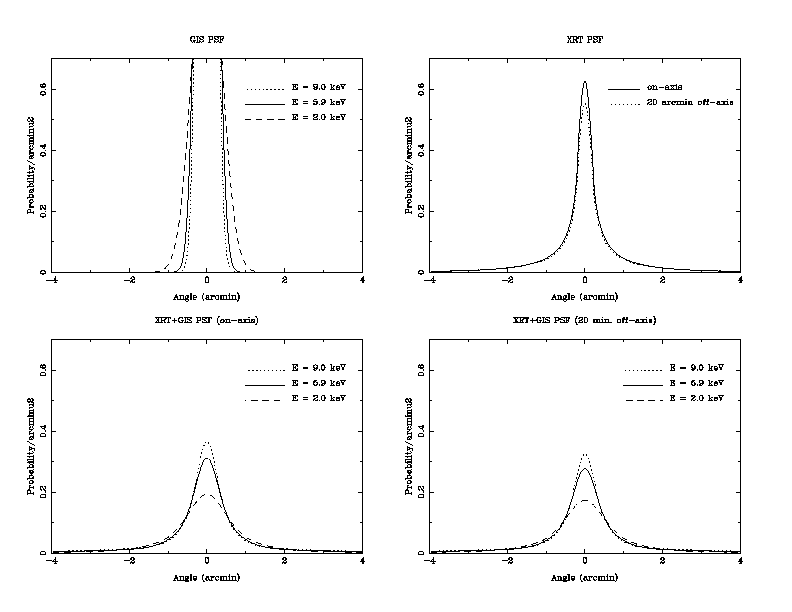
Figure 5.3c: The Point Spread Function of a single XRT, showing
also the intrinsic PSF of the GIS. Upper-left: The GIS point
spread function for three different incident X-ray energies. This is a
Gaussian with a FWHM of ![]() arcmin.
It is normalized so that integration over the entire area becomes
unity. Upper-right: The XRT point spread function for on-axis
and 20 arcmin off-axis. The Azimuthal dependence is averaged.
Lower-left: Convolution of the on-axis XRT and GIS point spread
functions. Lower-right: Convolution of the 20 arcmin off-axis
XRT PSF and the GIS PSF.
arcmin.
It is normalized so that integration over the entire area becomes
unity. Upper-right: The XRT point spread function for on-axis
and 20 arcmin off-axis. The Azimuthal dependence is averaged.
Lower-left: Convolution of the on-axis XRT and GIS point spread
functions. Lower-right: Convolution of the 20 arcmin off-axis
XRT PSF and the GIS PSF.
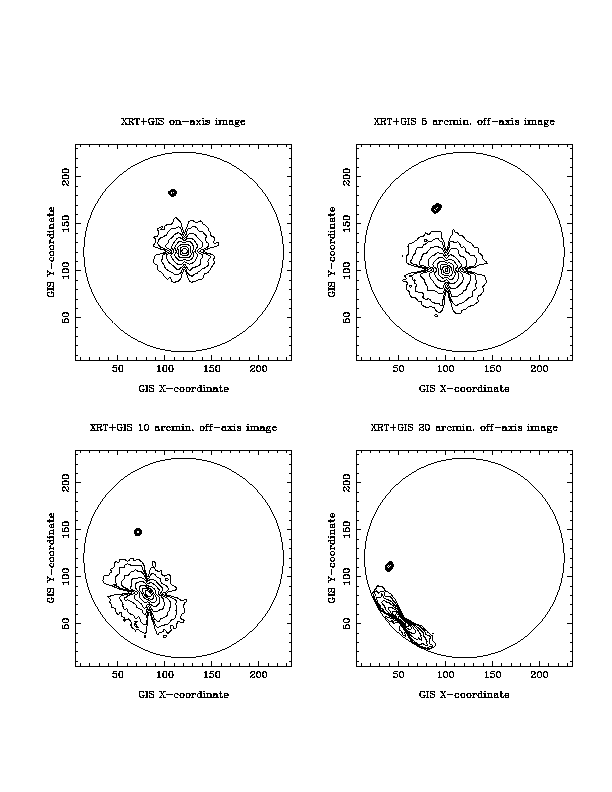
Figure 5.3d: The dependence of the XRT and GIS PSF as derived from ray-tracing calculations. Three off-axis angles (5, 10 & 20 arcmin) are shown as well as the on-axis case. The circle shows the GIS field of view. The contour scale is linear and the levels are common for all the figures.
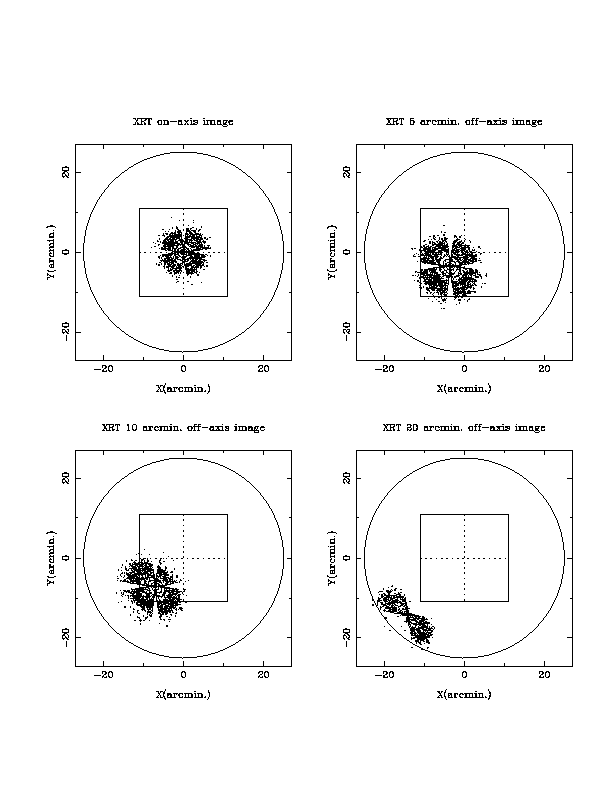
Figure 5.3e: As for Figure 5.3d but for the SIS. The solid square is the combined SIS field of view, while the dashed lines indicate the individual CCD chips.
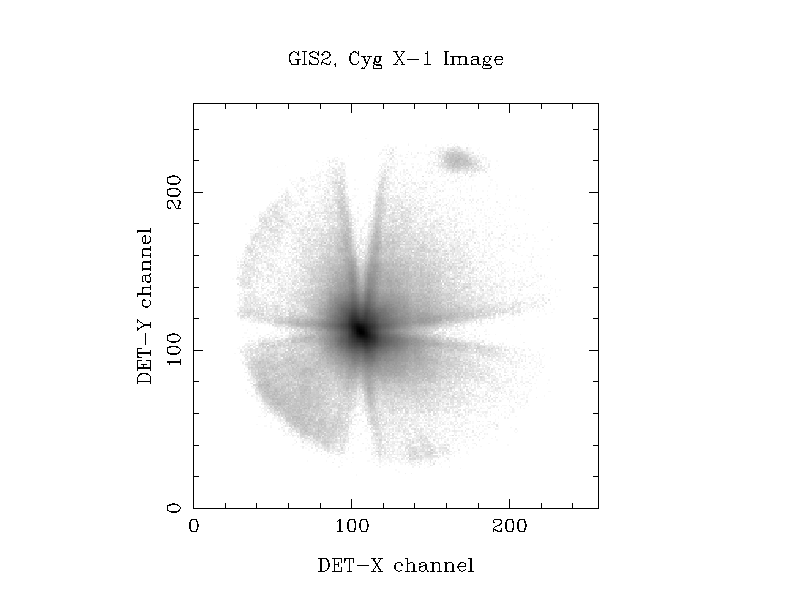
Figure 5.3f: A GIS2 image of Cyg X-1 accumulated for 40 ksec,
indicating the extended lobes of the PSF. This is plotted with a logarithmic
scale from ![]() to
to ![]() cts/pixel. The calibration source
is seen in the upper-right.
cts/pixel. The calibration source
is seen in the upper-right.