Status of the GIS gain calibration
Last updated on November 19, 2002
- Accuracy of the GIS gain determination
- Variation of the calibration source peak energies
- Method of the gain correction
- Limit of the radial gain correction
- Recalculate PI values using new calibration
Accuracy of the GIS gain determination
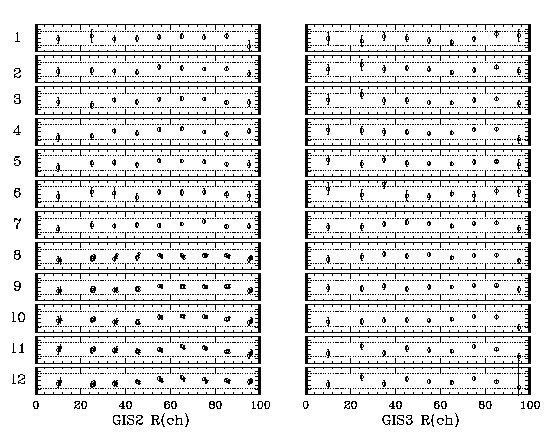
Accuracy of the absolute GIS energy scale is being monitored using the instrumental copper fluorescent line at 8.05 keV. The background spectra are accumulated using the dark-earth data for each about 12 months, and the detector region is divided into 10 concentric rings. The line energy is determined for each energy spectrum extracted for each period from each ring.The line energies for different periods and for each concentric ring are shown in the figure below (postscript file is available).
Range of the ordinate for each diagram is 7.9-8.2 keV, and the horizontal
dotted lines indicate +/-1 % of the correct energy (8.048 keV).
Abscissa is the radius (in channel) of the concentric rings.
In the GIS2 diagrams for the periods 8 to 12, circles are determined
with the parabola radial correction, while asterisks are due to the 4-th order polynomial correction
(see below for the radial correction).
The diagrams from 1 to 12 correspond to the following overlapping periods:
Data # Data Period 1 1993/04-1993/12 2 1993/07-1994/06 3 1994/01-1994/12 4 1994/07-1995/06 5 1995/01-1995/12 6 1995/07-1996/06 7 1996/01-1996/12 8 1996/07-1997/06 9 1997/01-1997/12 10 1997/07-1998/06 11 1998/01-1998/12 12 1998/07-1999/06
It is seen that the line energy is within +/- 1 % of the correct value
for all the periods and rings. Therefore, we conclude that accuracy of the current
GIS energy determination is within +/- 1 % at 8.05 keV over the detector,
at least until l 1999 June.
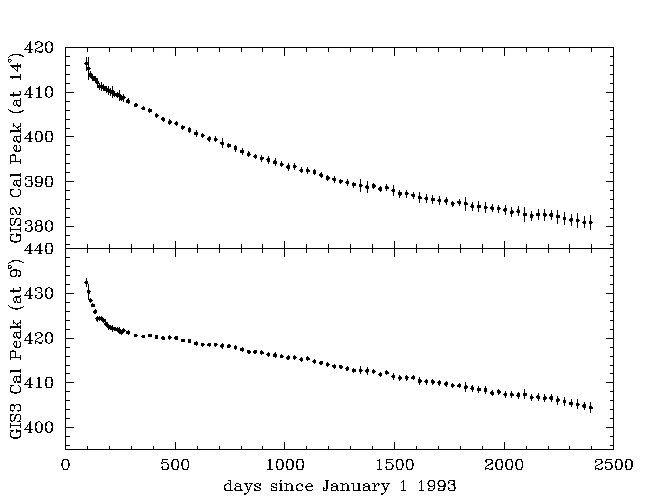
The following figure indicates the long term variation of the raw pulse-heights
of the calibration sources at fixed temperatures
(postscript file is available).
The long term gain change is regularly monitored by the GIS team, and
the temperature-gain conversion coefficients are determined for every
one month period. The time-dependent temperature-gain coefficients
thus determined are in the 1-st extension of the
gis_temp2gain.fits calibration file which is regularly released by the
GIS team. This files is used by the temp2gain ftool
to determine the instantaneous gain values for a given observation.
corrected PI values = original PI values / ( GMAPC0 + GMAPC1*r + ... + GMAPCn*r**n )
where r**2 = (DETX - DET_XCEN)**2 + (DETY - DET_YCEN)**2 , and GMAPCn are
time-dependent coefficients determined through calibration.
Coefficients of the polynomial function are determined by the GIS team every six months or so,
and released in the gis_temp2gain.fits file (written in the second extension).
Both for GIS2 and GIS3, a parabola function (only GMAP0 and GMAPC2) had been
adopted until the end of 1998 September. However, it had been found that
a fourth order polynomial describes the GIS2 radial gain variation better,
and new coefficients (GMAPC0 and GMAP4) have been
determined for the period
after October 1997 (see
the original announcement from the GIS team).
The fourth-order correction for GIS2 has been introduced since
version 4.3.17 of the gis_temp2gain.fits file, released on November 4, 1999.
Data taken between October 1997 to September 1998 have been originally processed with the
parabola method when delivered to the Guest Observers, but these data in the archives have been
reprocessed with the fourth order method (although the difference is insignificant;
see the figures above and below).
The temp2gain ftool determines the instantaneous radial
gain correction coefficients for each observation, through either interpolation or extrapolation
of the values in the gis_temp2gain.fits file, and these values are
written in the gain history files which are used by ascalin to calculate PI values.
The following figure shows the secular change of the polynomial function coefficients
for the gain-map correction (postscript file is available).
It is possible that the extrapolation is made as far as one-month for the temperature
coefficients or six-month for the gain-map correction coefficients.
It has been confirmed that the extrapolation method gives consistent answer
with the interpolation method. In panel 12 of
the figure shown at the top, data were accumulated
between 1998 July and 1999 June, while
the gain-map correction coefficients were determined partly through extrapolation using the data
taken between 1997 October and 1999 March; the Cu line energies are in the right place.
Unless GIS performance starts changing rapidly, we expect the extrapolation method will also be
reliable in future. In any case, in order to see if your gain history file
is made with extrapolation or interpolation, you may look at the processing information
on aux/ad*_hdr_page.html in the data package.
Here is an example of /cdrom/46009000/aux/ad46009000_001_hdr_page.html (/cdrom
is assumed to be the directory for mounting CD-ROM):
These calibration dates correspond to the following CALDB keywords in
gis_temp2gain.fits.
The update_gis_gain.pl
script will carry out the step 2 and 3 above automatically (please do not forget to edit the
first line of the script to point your local perl installation).

Variation of the calibration source peak energies
GIS has the iron 55 calibration sources attached at the detector rims.
They produce fluorescent lines at 5.89 keV (K-alpha) and at 6.49 keV (K-beta).
The calibration source peak is being monitored by the GIS team at Univ. of Tokyo/ISAS
and
by the GSFC ASCA Processing team,
Systematic energy shift from the correct energy and the secular energy variation
indicate the current limit of the GIS gain determination.
Note that the calibration sources are used to correct time variations
of the gains, but not used to determine the absolute gain, since
gain drops rapidly near the detector rim where absolute energy determination
is inevitably difficult.
Method of the gain correction
There are four components to take into account in order to determine the GIS gain and
correct energies for the GIS events:
Short-term variation
The short-term gain variation is known to be caused by temperature
variation of the sensor due to day-night transitions and/or satellite
aspect changes. This can be corrected using the temperature housekeeping
parameters.
For each observation sequence, a GIS gain history file is created by the
temp2gain ftool by looking at variation of the temperature
housekeeping parameters.
The gain history file, which is named like ft970210_0223_1750.ghf,
has the gain values for every 600 sec, for which the following
long-term variation and positional variation are taken into account.
The ascalin ftool uses the gain history file to carry out the
PHA to PI conversion.
Long-term variation

Position dependence
The position dependence of the gain is corrected using the gain-maps
which are in the calibration files gis2_ano_on_flf_180295.fits and
gis3_ano_on_flf_180295.fits, which have been determined through the pre-flight
ground calibration. The ascalin ftool reads these calibration files,
and carry out positional gain correction for each event.
Long-term variation of the position dependence
Secular change of the GIS gain map had been discovered. That is expressed with
a radial function in the first order approximation as follows:
Extrapolation of the gain parameters
As explained above, the temperature-gain coefficients and
the gain-map correction coefficients are determined by the GIS team
every one month and six months respectively.
When observation periods are covered by the periods
for which these correction coefficients have been determined, interpolation
is used to determine the instantaneous gain values.
If these coefficients have not yet been determined,
appropriate coefficients have to be calculated through extrapolation.
Observation Information

       Object: 1E1024.0-5732
       Nominal Pointing (degrees)
              R.A.=156.645 Dec.=-57.795
              Lii=284.579 Bii=-0.18
       Observation Date: December 27, 1998
       Duration: 102.3 kiloseconds (with 4 kiloseconds of telemetry gaps)
       Approximate SIS Exposure: 36.8 kiloseconds (approximately 38% with telemetry saturated)
       Approximate GIS Exposure: 28 kiloseconds

Processing Information

       Sequence Version: 001
       Processing Version: 7.3.0 (Revision 2)
       FTOOLS Version: 4.2
       Processing Date: March 27, 1999
       GIS Secular Gain Calibration Date: November 11, 1998
       GIS Gain Map Calibration Date: April 1, 1998
       SIS CTI Calibration Date: October 3, 1997
In this case, it is seen that both the Secular Gain (temperature correction)
and Gain Map Calibration Dates are after the observation, so
these coefficients are determined by extrapolation.
In the first extension (temperature coefficients):
CVED0001= '11/11/98'           / Dataset validity end date (UTC)
CVET0001= '0:0:0   '           / Dataset validity end time (UTC, of day CVSD)
In the second extention (gain-map correction coefficients):
CVED0002= '1/4/98  '           / Dataset validity end date (UTC)
CVET0002= '0:0:0   '           / Dataset validity end time (UTC, of day CVSD)
Also, they correspond to dates of the last entries in the 1st extension
and the 2nd extension respectively.
Limit of the radial gain correction
Because the gain drops rapidly near the detector edge, as well as
the particle background is prominent there, as a default,

Recalculate PI values using new calibration
As explained above, a new version of the gis_temp2gain.fits calibration file
is released once every few months, and your GIS data may not have been processed with the
latest one.
If you want to recalculate the PI values
in your GIS event files using the latest gis_temp2gain.fits file,
here is the procedure:
References
The present study was mostly conducted by H. Kubo, A. Kubota and M. Tashiro
of the GIS team. If you have questions about issues presented in this page,
please contact the ASCA GOF: visit the
Feedback form.
If you have any questions concerning ASCA, visit
our Feedback form.

