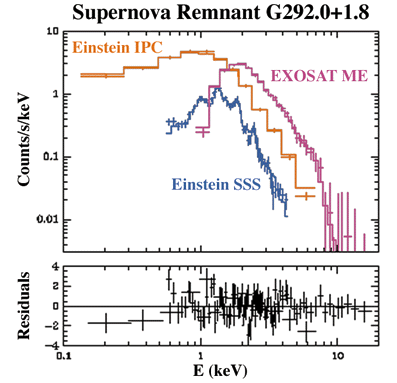
G 292.0+1.8Einstein IPC, SSS and EXOSAT ME spectra of G 292.0+1.8.These spectra are important not so much for what they tell us about the SNR as for what they show about differences in data from different satellites. These spectrum, shown in units of count/s/keV as a function of energy, are in "detector space." The relative intensity is a function both of the intensity of the source (the SNR) and the effective area of the detector. Thus, without an intimate knowledge of the detectors and their responses at different frequencies, it is difficult to compare spectra. At the high end of the spectra, the power law visible in each plot is similr, and probably represents a physical condition. But at the lower end of the spectra, where the data from the three satellites looks very different, it is more difficult to tell what is physical and what is a result of the instrument's capabilities. This is a long-standing problem in X-ray astronomy and is one reason why a facility like the ASCA Guest Observer Facility is so important for making sure that data are analyzed in a consistent manner.
IMAGES |
By Mission |
Stars |
HEASARC Home | Observatories | Archive | Calibration | Software | Tools | Students/Teachers/Public Last modified: Thursday, 26-Jun-2003 13:48:44 EDT |


