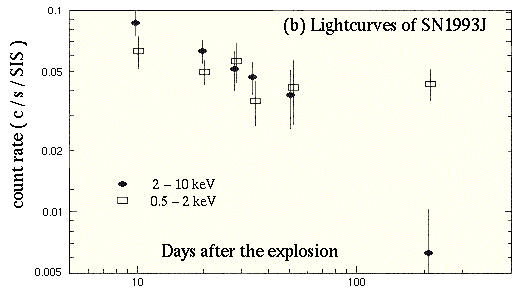
ASCA Light Curve of SN 1993JX-rays from the supernova SN 1993J in the spiral galaxy M81. This plot shows two-color X-ray lightcurves, plotted against the logarithm of days after the explosion. A faster decay in the higher energy band indicates a cooling in the emission region.
IMAGES |
By Mission |
Stars |
HEASARC Home | Observatories | Archive | Calibration | Software | Tools | Students/Teachers/Public Last modified: Thursday, 26-Jun-2003 13:48:44 EDT |


