

Next: Time variability studies
Up: FEASIBILITY: XMA+PSPC
Previous: Positional accuracy
The energy-to-counts conversion factors in
Figures 10.2  - 10.13
 apply
only to on-axis observations. For off-axis observations the effective area
and consequently the expected count rates will be reduced. In addition
the source counts will be spread over a larger area in the detector
due to the telescope blur. The reduction in effective
area does not depend sensitively on energy for energies
below
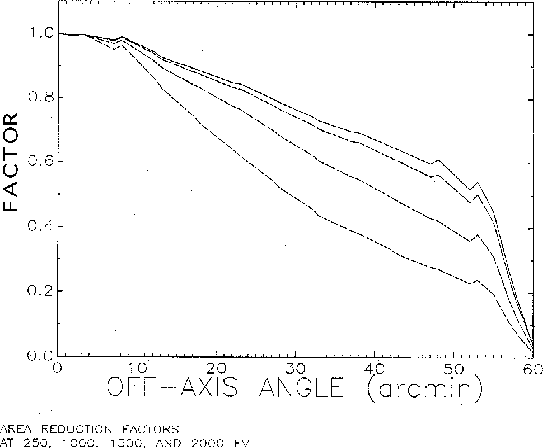
  keV. In Figure 10.18
  the ratio of on-axis to off-axis effective area is plotted as a function
of off-axis angle for energies 0.2 keV, 1 keV, 1.5 keV and 2 keV.
With the information provided in Figures 10.2
  - 10.13
 and Figure 10.18
  the
calculation of off-axis count rates is possible.


In order to estimate the reduction in sensitivity due to the increasing
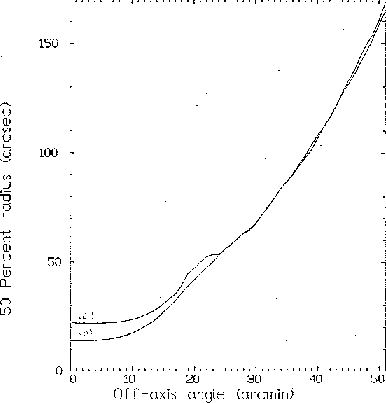
spread of the point response function we show in
Figure 10.19  the radius
of the circle containing 50 percent of the counts vs. off-axis
angle for a soft source (curve a) and a hard source (curve b). While the
50 percent circle radius depends on energy in the center of the field of
view, at off-axis angles larger than
  the point response function
does not depend sensitively on energy.


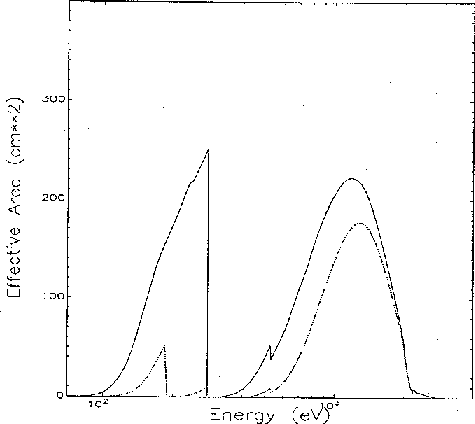
For guest investigators wishing to perform more detailed calculations we
provide in Figure 10.20  the effective on-axis area of the XRT+PSPC combination
with and without the boron filter.


Michael Arida
Tue Jun 11 16:18:41 EDT 1996
 - 10.13
 apply
only to on-axis observations. For off-axis observations the effective area
and consequently the expected count rates will be reduced. In addition
the source counts will be spread over a larger area in the detector
due to the telescope blur. The reduction in effective
area does not depend sensitively on energy for energies
below
  the ratio of on-axis to off-axis effective area is plotted as a function
of off-axis angle for energies 0.2 keV, 1 keV, 1.5 keV and 2 keV.
With the information provided in Figures 10.2
  - 10.13
 and Figure 10.18
  the
calculation of off-axis count rates is possible.


