

Next: Hardness Ratios
Up: Spectral Response
Previous: Temporal Gain Variations
G. Fraser [Fraser1992]
has analyzed the on-axis ground based data by
fitting Pearson functions to the 7 pulse height distributions shown in
Fig. 5.16.
A detailed analysis of his results are given in his report.
The relative FWHM of the fitted pulse height distributions vary
from 66% (for the Al-K and Fe-K lines) to 107%(for the B-K line).
Fraser concludes that ``the average pulse height per pixel has very
little dynamic range and is a very poor indicator of photon energy''.
However, he also notes that ``the softness ratio,
(counts in channels 1-5)/(counts in channels 6-11),
used by
[Wilson et al.1992]
does seem the most sensitive energy indicator that can be constructed.''
(As noted below, the actual channels fulfilling this purpose will
change as a function of the temporally-dependent gain.)

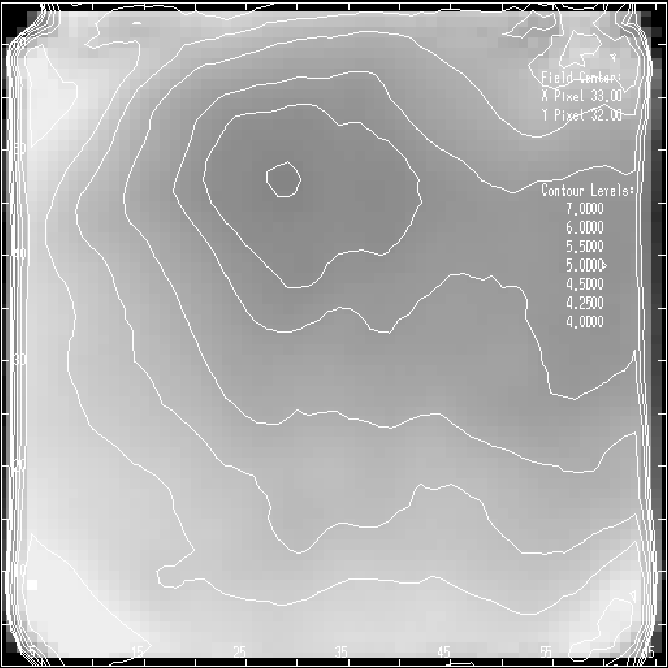
Figure 5.17: The spatial variation in the centroid of the pulse height
distribution in the ground based Cu(0.93 keV) flat field image.
The image was first blocked by a factor of 64, producing 32''
pixels with 1% statistical errors. The contours are at PHA values
of 4.0, 4.25, 4.5, 5.0, 5.5, 6.0, 7.0 and increase outward.

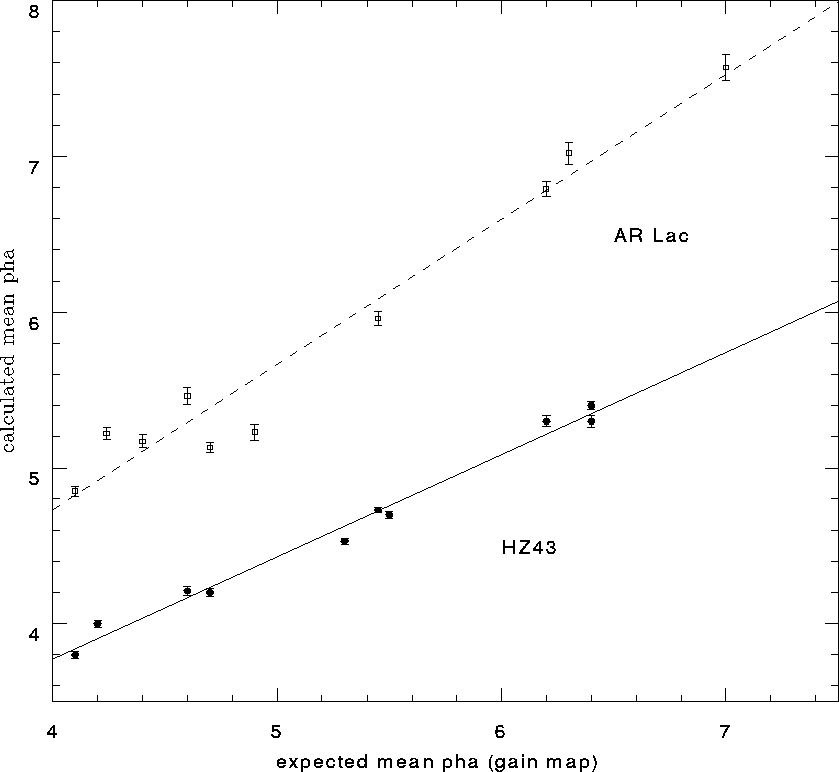
Figure 5.18: PVC phase observations of HZ 43 and AR Lac were taken at many
positions on the detector surface. The observed mean PHA of
the calibration source measurements are plotted with errors
against the expected mean PHA from the ground based
measurements of copper (0.93 keV). The line represents the
best least squares fit of the data points.

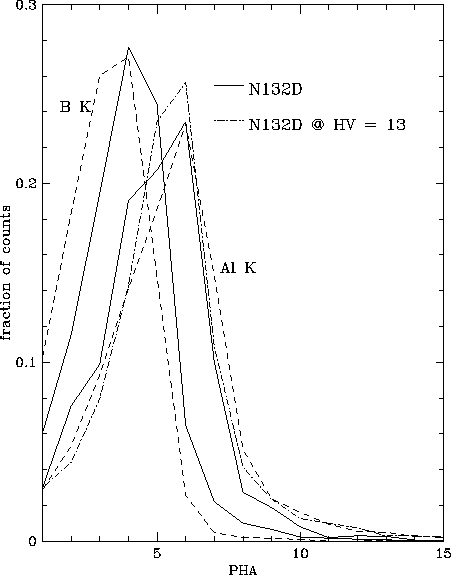
Figure 5.19: The pulse height distribution in 3 HRI observations of N132D.
The highest gain observation (solid line) was taken during
the PVC phase, the lowest gain observation was taken in
1993 April, and the observation shown in the dot-dash line
was taken in 1994 July, just after the HV increase.
Also shown (dashed lines) are the pulse height distributions
of the Al-K (1.49 keV) and B-K (0.18 keV) lines obtained
during the ground based tests.
Although the total count rate (in all PHA channels) has
remained nearly constant
(see Tab. 5.4),
the earlier observations show a downward trend in the peak
of the distribution. The latest observation shows that the
HV increase has restored the peak to within 0.5 channels
of the original.
Using the ground-based data
(see Fig. 5.16)
we constructed a spectral redistribution matrix for the HRI.
We then fit the pulse height distributions of several observations
of HZ 43 and one observation of 3C273.
PSPC spectra of HZ 43 are well fit with an unabsorbed black body
spectrum with a temperature of 0.02keV (  for 24 degrees
of freedom).
Table 5.8
lists the
  values obtained by fitting the HRI observations
of HZ 43 with the same unabsorbed black body spectrum,
with only the normalization treated as a free parameter.
The minimum
  values are extremely high no matter what
PHA channels are included in the fit.
The best fit absorbed power-law model to the PSPC spectrum of 3C273
is obtained with
  cm
cm  and
an energy index of
  .
Since the HRI observation of 3C273 has 30,000 net counts we fit
the HRI spectra with 0, 2, and 5% systematic errors,
added in quadrature with the statistical errors.
Table 5.9
lists the minimum
  values obtained by fitting the HRI\
observation of 3C273 with
  and
and  fixed.
We also fit the HRI pulse height distribution treating
  as a free parameter.
The best fit energy index so obtained for 3C273 is significantly
steeper than that obtained from the PSPC observation.


Next: Hardness Ratios
Up: Spectral Response
Previous: Temporal Gain Variations
If you have problems/suggestions please send mail to
rosat_svc@mpe-garching.mpg.de


