XMM-Newton
Users Handbook
Examples of RGS spectra are given in Figs. 90 to
99. A significant fraction of the apparent
continuum background measured underneath the Fe-L forest, is due to
scattered light. This is included in the response matrix of the
instrument, which has to be used to determine the underlying spectral
properties.
Figure 90:
Coronal spectrum of the binary star Capella adapted from
Audard et al. 2001, A&A 365, L329. The RGS1 first order spectrum is shown with some line
identifications. The total exposure time is 53 ks.
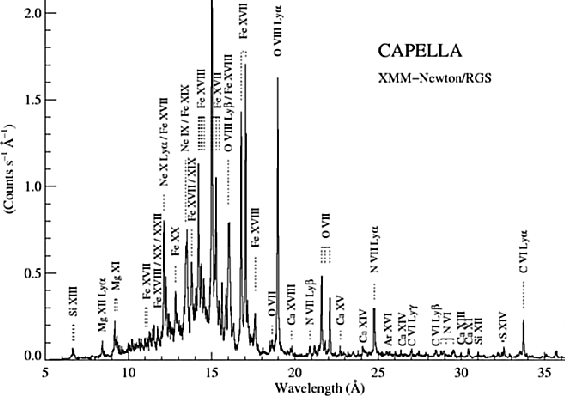 |
Figure 91:
RGS spectra of the highly variable low-mass X-ray binary
EXO 0748-67. The three panels show the spectra for three different
activity states: low emission, active variation and burst. The
spectra are binned to 0.035 Å per bin. The cumulative exposure
time for each spectrum is indicated (Cottam et al. 2001, A&A 365, L277).
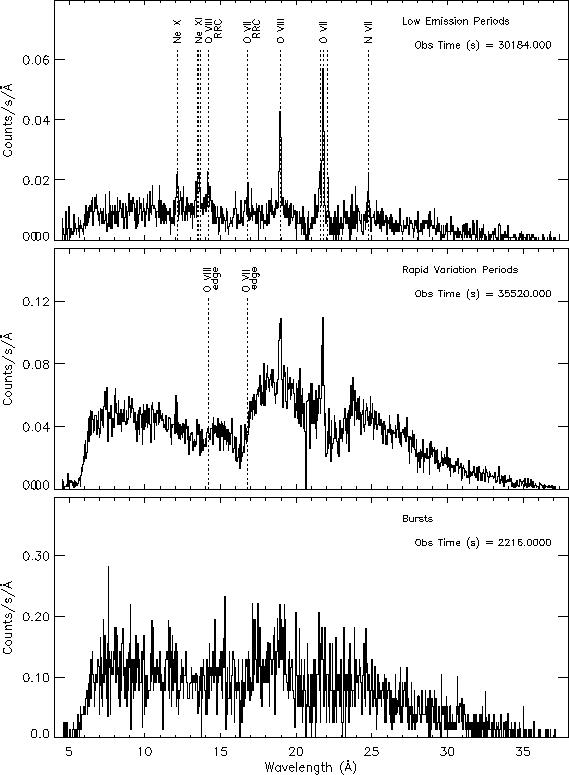 |
Figure 92:
Detail of the EXO 0748-67 RGS spectrum. The O VII He-like
lines are shown overlaid with the instrument line spread function,
broadened to account for a 1390 km s velocity field. The
contributions from the resonance line (r), intercombination lines
(i), and forbidden line (f) are shown with thin lines. The thick
line shows the combined fit (Cottam et al. 2001, A&A 365, L277).
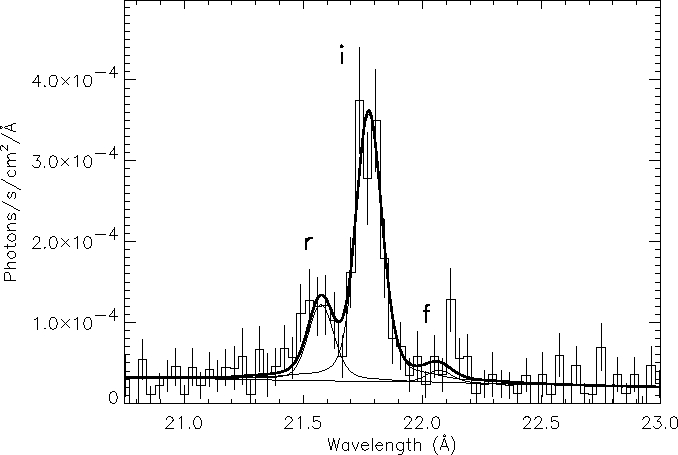 |
Figure 93:
The first order RGS spectrum of the SMC supernova remnant
1E 0102.2-7219. The effective exposure time is 29.7 ks for each RGS
after selection of low background periods in a 37.9 ks
exposure. RGS1 is plotted in black, RGS2 in red. The data are shown
in both linear and logarithmic scales. This figure and the next show
that almost the nominal RGS spectral resolution can be achieved even
for moderately extended ( 2
2 ) objects
(Rasmussen et al., 2001, A&A 365, L231).
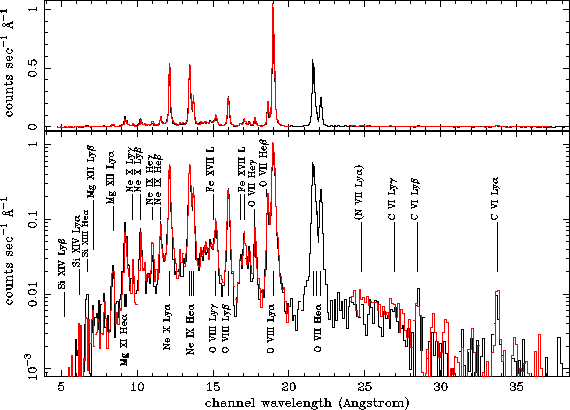 |
Figure 94:
Detail of the 8-20 Å region of the spectrum shown in
the previous figure. First (black) and second (red) order are
plotted separately. The data from the two spectrometers have been
averaged for each order extraction. The higher spectral resolution
and resilience to source extent is clearly seen in second order,
where some line complexes blended in first order are resolved
(Rasmussen et al., 2001, A&A 365, L231).
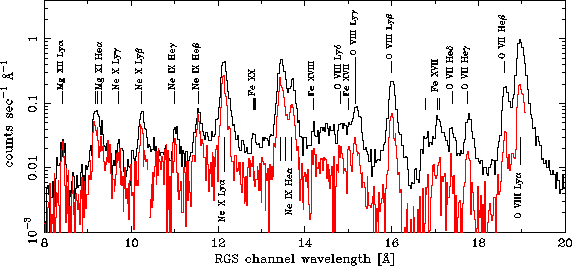 |
Figure 95:
Detail of the Oxygen line profile in the 1E 0102.2-7219
spectrum. The plot compares the point source line spread function
for RGS1, the approximate monochromatic line profile based on the
target's angular distribution and a heuristic wavelength broadening
function that is applied in addition to the angular distribution
(Rasmussen et al., 2001, A&A 365, L231).
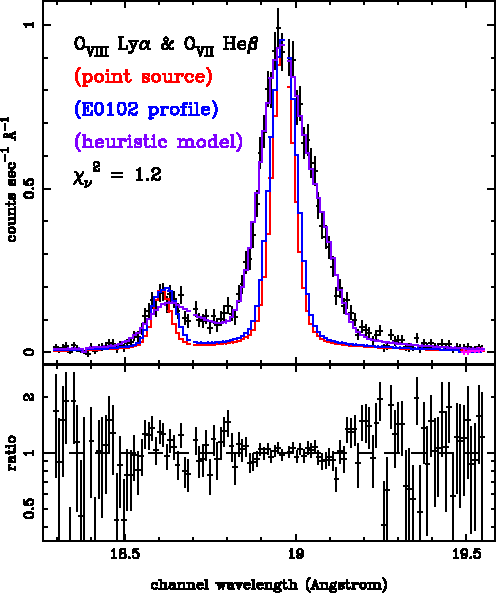 |
Figure 96:
RGS spectrum of the bright starburst nucleus of the nearby
edge-on galaxy NGC 253, binned to 0.07 Å per bin. The effective
exposure time is  53.4 ks for each spectrograph, after
selection of low background periods. The extraction region is
1
 along the minor disk axis. (Pietsch et al. 2001, A&A 365, L174).
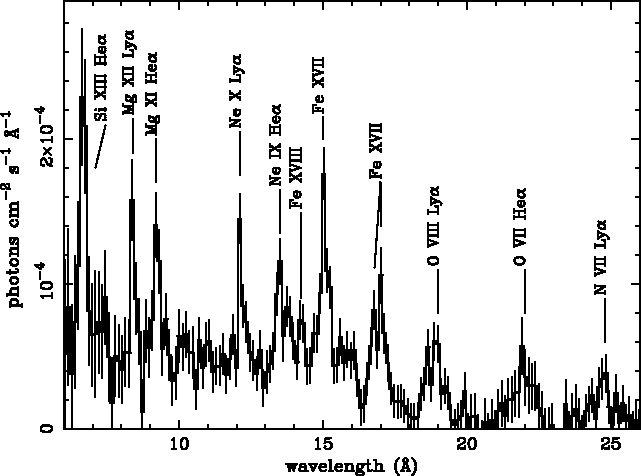 |
Figure 97:
RGS spectra of two bright, nearby, Narrow Line Seyfert 1
galaxies. MCG-6-30-15 (top) was observed for a total of 120 ks
while the exposure time for Mrk 766 (bottom) was 55 ks.
(Branduardi-Raymont et al. 2001, A&A 365, L140).
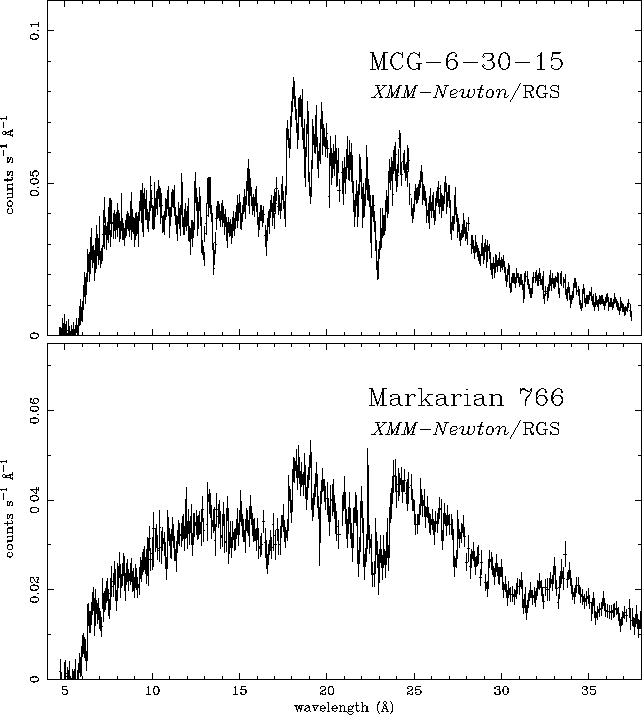 |
Figure 98:
The RGS spectrum of the rich cluster of galaxies Sérsic
159-03 (Abell S 1101). The effective exposure time is 36 ks. The
plot also shows in red a fit with a two component cooling flow
model. Note the redshifted O VIII Ly  line at 20.0 Å and
the Fe XXIV, Fe XXIII and Ne X lines between 11.2 and 12.8 Å
(Kaastra et al. 2001, A&A 365, L99).
 |
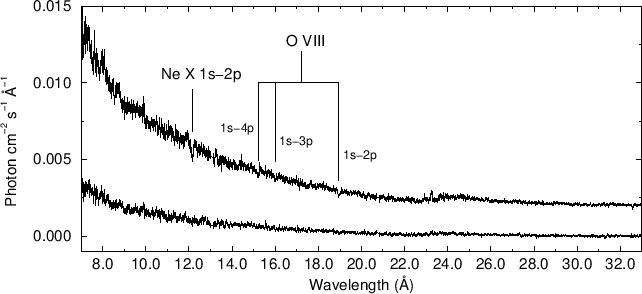
Figure 99:
First order RGS spectra of the dipping, transient low-mass
X-ray binary MXB 1658-298. The upper curve is the persistent
emission spectrum and the lower curve that of the dipping
intervals. Narrow absorption lines of O VII and Ne X are visible in
the persistent spectrum revealing the presence of a warm absorber
(Sidoli et al. 2001, A&A 379, 540).
 |
European Space Agency - XMM-Newton Science Operations Centre


