The maximum useable count rate of the GIS is limited by the telemetry capacity. The telemetry limit for each GIS mode and bit rate is tabulated in Table 8.1. The maximum observable source intensity is, of course, achieved with high bit rate, and it reduces by a factor of 1/8 with medium bit rate.
The maximum count rate in PH mode with high bit rate is 128 count
s![]() for each GIS. Since 1 Crab
for each GIS. Since 1 Crab ![]() 500
count s
500
count s![]() GIS
GIS![]() , the maximum source intensity when only
one source is in the GIS field of view (FOV) is
, the maximum source intensity when only
one source is in the GIS field of view (FOV) is ![]() 250 mCrab
using the two GIS.
250 mCrab
using the two GIS.
In the PCAL mode, the maximum count rate with the high bit rate is
16 count s![]() GIS
GIS![]() or
or ![]() 30 mCrab. In the MPC mode,
sacrificing the time resolution, the telemetry limit is as much as 128
Crab, but, in practice,
30 mCrab. In the MPC mode,
sacrificing the time resolution, the telemetry limit is as much as 128
Crab, but, in practice, ![]() 20 Crab is the maximum due to the
dead time of the pre-amplifier.
20 Crab is the maximum due to the
dead time of the pre-amplifier.
The GIS spatial resolution is much more limited than that
of the SIS. The position
resolution of GIS is determined by the statistics used by the position
determination algorithm. The point spread function of the GIS
alone is a Gaussian with FWHM ![]() mm (Figure 5.3d). Note that this is smaller than the
XRT HPD (3'
mm (Figure 5.3d). Note that this is smaller than the
XRT HPD (3' ![]() 3 mm), but significantly larger than the
sharp core of the XRT PSF. Consequently, the convolved PSF of the
XRT+GIS becomes much broader than that of XRT alone, and the
original detailed structures in the XRT image are smeared in the GIS
image. Studying small structures on a scale
3 mm), but significantly larger than the
sharp core of the XRT PSF. Consequently, the convolved PSF of the
XRT+GIS becomes much broader than that of XRT alone, and the
original detailed structures in the XRT image are smeared in the GIS
image. Studying small structures on a scale ![]() , which may be
carried out with the SIS, will not possible with the GIS.
, which may be
carried out with the SIS, will not possible with the GIS.
See §6.5.3 for caveats concerning the useable field of view of the GIS.
Unlike the SIS, the GIS does not have intrinsic limitations which may impede observations down to the maximum time resolution. In PH mode, the moderate telemetry limit and a significant CPU deadtime ( 8 msec/event) makes estimating the Poisson noise level difficult for bright sources. Consequently, aperiodic time-variation studies of bright sources (e.g. QPO study) will not be suitable using PH mode data. However, GIS monitor data, for which the telemetry limit is 2048 cts/s/sensor and the time resolution is 0.125 sec (high bit-rate), may be used to investigate short term variations of bright sources. The deadtime of the monitor data is 25 micro-sec/event. Note that neither energy nor spatial resolution is available for the GIS monitor data.
Coherent timing studies (e.g. of pulsars, pulsar searches) are feasible with PH mode. The accuracy of the photon arrival time is limited by the time assignment of the satellite, which is believed to be correct down to a few tens of msec.
In GIS PH mode, each event is specified by 32 bits, one of
which is used to identify the detector itself (GIS2 or GIS3).
The rest specify the pulse height, X and Y coordinates,
event rise-time, spread of UV light and timing.
Allocation of these 31 bits can be programmed from the
ground and can be specified by Guest observers.
The default bit assignment is PH-X-Y-RT-SP-TIME=10-8-8-5-0-0.
Hence, by default GIS PH mode data has 1024 pulse-height
channels, ![]() spatial resolution, and
32 rise-time channels. The rise-time information
is used for background rejection by Guest
Observers in the data analysis stage. The UV-light spread
information is diagnostic and not necessary for scientific
purposes. In the default mode the time resolution is 62.5 msec
for high bit rate, 8 times better than for medium bit rate.
The number of timing bits can be increased up to 10,
corresponding to a maximum resolution of
spatial resolution, and
32 rise-time channels. The rise-time information
is used for background rejection by Guest
Observers in the data analysis stage. The UV-light spread
information is diagnostic and not necessary for scientific
purposes. In the default mode the time resolution is 62.5 msec
for high bit rate, 8 times better than for medium bit rate.
The number of timing bits can be increased up to 10,
corresponding to a maximum resolution of ![]() ,
by trading off information from other parts of the bit allocation.
For example, by setting the
bit-assignment as PH-X-Y-RT-SP-TIME=8-8-8-0-0-7, which may be
appropriate for observations of fast rotating pulsars,
the time resolution becomes 0.488 msec, and
the number of pulse-height channels reduced to 256 and
the rise-time information becomes unavailable.
,
by trading off information from other parts of the bit allocation.
For example, by setting the
bit-assignment as PH-X-Y-RT-SP-TIME=8-8-8-0-0-7, which may be
appropriate for observations of fast rotating pulsars,
the time resolution becomes 0.488 msec, and
the number of pulse-height channels reduced to 256 and
the rise-time information becomes unavailable.
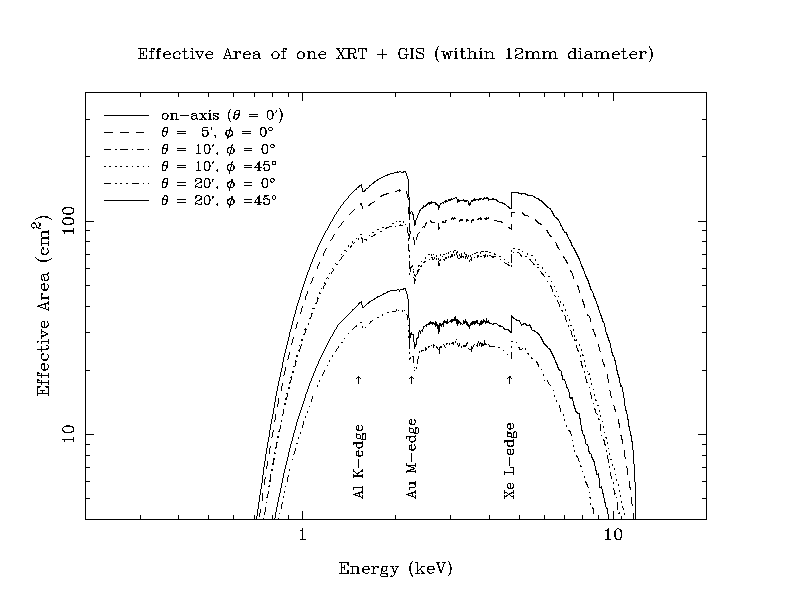
The energy range over which the sensitivity of the GIS is more than 10 per cent of the maximum is 0.8-12 keV (Figure 8.4a). The lower end is mainly limited by absorption in the beryllium window, but the two mylar and aluminum windows (the XRT thermal shield and the GIS plasma shield) also contribute. The higher end is determined by the photoelectric absorption coefficient of the xenon gas. Off axis, the XRT+GIS effective area decreases due to telescope vignetting, but the efficiency of the GIS alone does not depend on incident X-ray position.
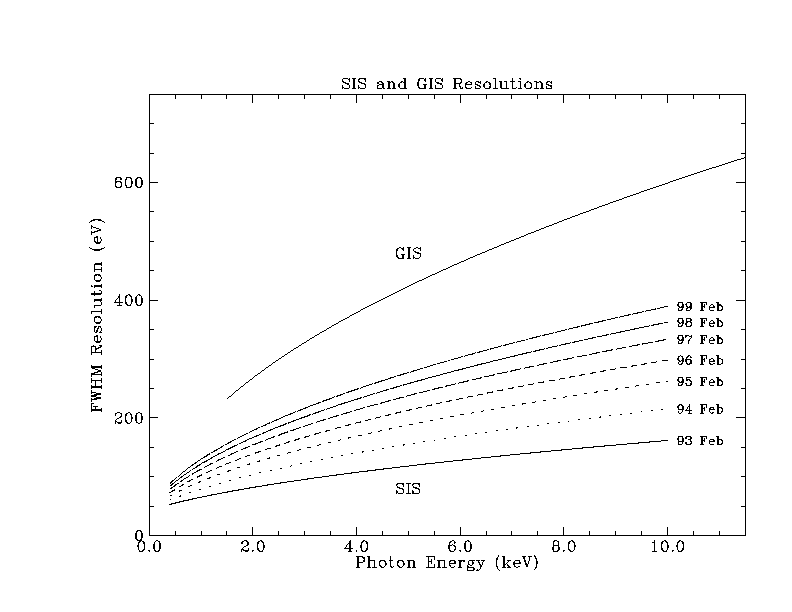
The energy resolution of the GIS is about ![]() per cent (FWHM) and is shown in Figure 8.4b
per cent (FWHM) and is shown in Figure 8.4b
The deadtime effect does not alter the spectral distribution of the PH mode data so spectral study of bright sources is still feasible even if the data are telemetry saturated. The correct source flux can be deduced by applying the currently available deadtime corrections.
The ultimate sensitivity of ASCA is set by the Poisson noise of
source and background photons and by the confusion limit. For the
former, particle background, truly diffuse cosmic X-ray background,
unresolved background sources and the wings of resolved sources
must be taken into account.The GIS internal background is ![]() count s
count s![]() XRT
XRT![]() HPD.
The SIS internal
background is less than this. As for X-ray
background, even when individual sources can be resolved,
significant power is contained in the very broad wings of the PSF
where the contribution from these sources will effectively become a
quasi-uniform background.
HPD.
The SIS internal
background is less than this. As for X-ray
background, even when individual sources can be resolved,
significant power is contained in the very broad wings of the PSF
where the contribution from these sources will effectively become a
quasi-uniform background.
The estimate of extragalactic background of ![]() 10
10![]() ergcm
ergcm![]() s
s![]() keV
keV![]() sr
sr![]() corresponds to
corresponds to ![]() count s
count s![]() over all four SIS CCDs and this is about
what is observed in practice. For this GIS it is
over all four SIS CCDs and this is about
what is observed in practice. For this GIS it is
![]() 0.4 count s
0.4 count s![]() if one takes a region 40 arcmin in diameter, excluding
the edges with high internal background. Exposure times for, e.g.,
5
if one takes a region 40 arcmin in diameter, excluding
the edges with high internal background. Exposure times for, e.g.,
5![]() detection of sources, can be calculated using a uniform
background. Figure 8.5 illustrates the required exposure times for
a
detection of sources, can be calculated using a uniform
background. Figure 8.5 illustrates the required exposure times for
a ![]() detection in the SIS for a background of 0.15 count
s
detection in the SIS for a background of 0.15 count
s![]() (solid curve). For comparison, the corresponding curve
for a background of 0.30 count s
(solid curve). For comparison, the corresponding curve
for a background of 0.30 count s![]() is also shown (dashed).
is also shown (dashed).
An alternative view is to assume that all extragalactic background
can ultimately be resolved into faint point sources. In this case, the
sensitivity is set by the confusion limit. Assuming the ![]() relation by Piccinotti et al. (1982), the intensity at which only
one source would be found in the XRT half power diameter (3
arcmin) is
relation by Piccinotti et al. (1982), the intensity at which only
one source would be found in the XRT half power diameter (3
arcmin) is ![]() erg s
erg s![]() cm
cm![]() . This
roughly corresponds to 0.4
. This
roughly corresponds to 0.4 ![]() Crab or
Crab or ![]() count s
count s![]() XRT
XRT![]() HPD. Close to this flux level, source detection cannot be
achieved with confidence.
HPD. Close to this flux level, source detection cannot be
achieved with confidence.
Confusion limited observations will likely require too much time to
be of interest to guest observers. Moreover, a 5![]() detection
will not allow any spectral analysis, which is the strength of
ASCA.
detection
will not allow any spectral analysis, which is the strength of
ASCA.

Figure 8.4a: The effective area of a single GIS combined with a
single XRT for five off-axis angles (0, 5, 10, 15, 20 arcmin). The
transmission of the XRT thermal shield of XRT and the plasma shield
of the GIS--both are made of 0.5 ![]() m mylar + 30 nm Al--is
taken into account.
m mylar + 30 nm Al--is
taken into account.

Figure 8.4b: The energy resolution of the GIS and SIS. The GIS resolution is believed to be stable; for the SIS, the estimated/extrapolated resolution of SIS-1 in 1-CCD mode is plotted for at launch and 1, 2, 3, 4 , 5 and 6 years after launch. SIS-0 resolution is degrading somewhat more slowly than that of SIS-1. In 2 and 4 CCD modes, the RDD effect further degrades the resolution somewhat.

Figure 8.5: 5![]() detection limit of ASCA calculated
assuming two different background rates, a PSF appropriate for
the SIS, and circular detection cells whose size is optimized for the
particular values of relative count rates. The bottom of the figure
(10
detection limit of ASCA calculated
assuming two different background rates, a PSF appropriate for
the SIS, and circular detection cells whose size is optimized for the
particular values of relative count rates. The bottom of the figure
(10![]() count s
count s![]() ) is the source strength at which the
predicted density is 1 per XRT HPD (using the Piccinotti
) is the source strength at which the
predicted density is 1 per XRT HPD (using the Piccinotti
![]() -
-![]() relationship) . The average extragalactic
background roughly corresponds to 0.15 count s
relationship) . The average extragalactic
background roughly corresponds to 0.15 count s![]() per SIS FOV,
some of which will be resolvable into individual sources at long
exposure times. The detection limits are broadly similar for SIS and
GIS and depend sensitively on the precise nature of the cosmic X-ray
background.
per SIS FOV,
some of which will be resolvable into individual sources at long
exposure times. The detection limits are broadly similar for SIS and
GIS and depend sensitively on the precise nature of the cosmic X-ray
background.