THE EXOSAT RESULTS DATABASE
The EXOSAT database will contain the principal results obtained from a standard analysis
performed on every observation. The objective is to provide a computer accessible
overview of each observation. This will include a summary of the results from each instrument, as
well as the option of obtaining the data in a reduced form (e.g. compressed
images, background subtracted spectra, lightcurves etc).
A data base management system will allow manipulation of the results summary files
(e.g. cross- correlating parameters). The database will in many cases circumvent
the need for astronomers to analyse the final observation tapes (FOTs). This
system will be accessible by remote users via the SPAN network and will include
the possibility of file transfer, both of data and programs.
A preliminary version of the results summary data base has been generated using the
output of the first version of the automatic analysis of the data from the low energy telescope. The reprocessing of
all data using second generation software is now well underway and the full database
system is expected to be available by the end of 1988.
I. Introduction
Over the past twenty years X-ray astronomy has evolved from a field where a few
specialists were studying a hundred poorly understood X-ray sources, to the rich
field it is today where virtually every known astrophysical object is at some
level an X-ray source. This transformation has resulted in non-specialist
astronomers using the more recent X-ray astronomy observatories such as
Einstein and EXOSAT. One major problem for a newcomer to data obtained from an X-ray observatory like
EXOSAT is the complexity of the data acquisition modes used and the rather specialized
knowledge required to perform relatively basic tasks such as background
subtraction. To undertake the analysis of this data requires a considerable
investment in time to write the appropriate software and to gain experience in
the nuances of a particular instrument. Such an effort is only worthwhile at
institutes expecting to analyse a fairly large fraction of EXOSAT observations. Up to now the non-specialist has been dependent on the
EXOSAT interactive analysis system provided by ESA, which has meant traveling to
ESTEC/ESOC to access the data. To improve this situation an EXOSAT
results database is being setup that will contain the following:
(i) the basic results from each instrument for every observation, so providing an
immediate overview of the results from each EXOSAT observation.
(ii) a database management system for cross- correlating those results against
each other as well as against other astronomical catalogues and databases.
(iii) the data in a reduced form e.g. background subtracted spectra and images.
(iv) remote access, via SPAN, with the possibility to extract the reduced data
and analysis software.
The output from the LE automatic analysis has been used to
create a preliminary version of (i) and (ii). This has proved extremely
successful and the full database is now being implemented. This has involved an
updating and rewriting of the automatic analysis programs to take into account
the latest calibrations and analysis techniques. The reprocessing of the ME data
is now over 70% complete (as of August 87). The GSPC reprocessing started in June
87 and the LE in September 87. The database will be ready for public consumption
by the end of 1988, with some limited access possible prior to that date.
This document describes the structure of the database and the way it is being
implemented. While many of the components are now in place the system is
relatively flexible and it may be possible to make revisions to include any
suggestions arising from this report.
II. The Data Base Management System
There are four instrument summary files which contain the principal results from
each instrument (L1, L2, ME and GS) for the entire mission. A fifth slew summary
file contains a record of all X-ray sources detected by the ME experiment while the
spacecraft was slewing from one target to the next. In addition background
subtracted grating spectra will also be available. For the instrument summary
files there will be one entry per source, with up to 220 parameters stored for
every entry. The summary files are accessed by a database management system (DMS)
developed at the EXOSAT Observatory. This software package has been specifically
designed to manipulate large amounts of astronomical data. The system, besides
providing 0 the basic functions supported by the majority of commercially
available packages, also allows a number of statistical tests frequently used in
astronomy, The main facilities are:
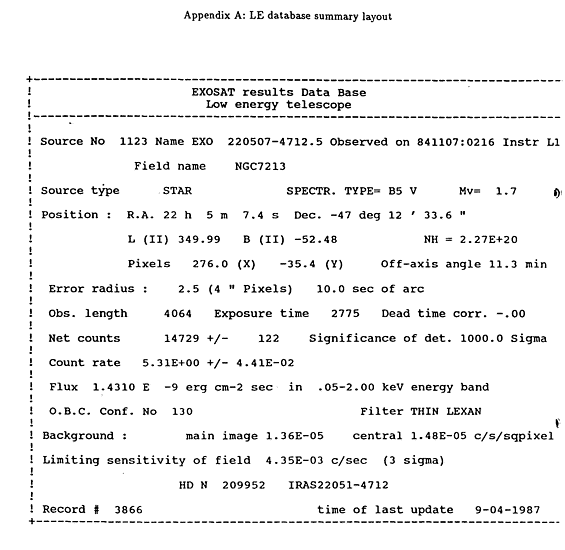
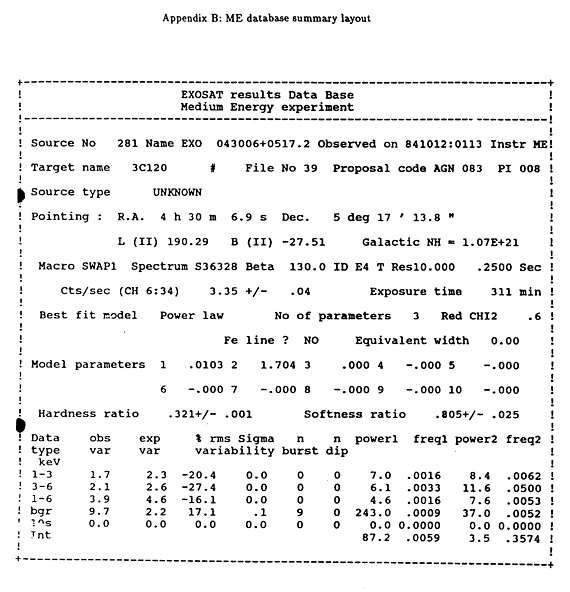
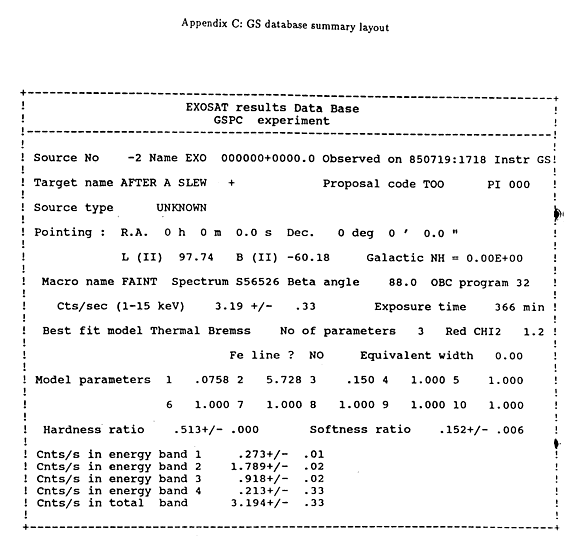
1. The possibility to display to any terminal the basic results information for
every entry. Examples of this are given in Appendix A, B, and C for each
experiment.
2. Retrieve information on sources located in a specified area of the sky.
3. Select subsets using any relation of the Boolean algebra.
4. Cross- correlation of the four summary records, or of any subset with catalogues
of cosmic sources.
5. Definition of new parameters. These can be virtually any function of the
primary parameters i.e. parameters directly stored in the database. Parameters
defined in this way are called derived parameters.
6. Possibility to sort the database (or any subset of it) by any primary or
derived parameter.
7. Production of ASCII tables of primary or derived parameters.
8. Generation of histograms of any primary or derived parameter.
9. Plotting of parameters against each other.
10. Possibility to fit analytical functions to the data.
11. Statistical analysis e.g. Calculation of mean value,
variance, regression analysis,  , etc.
Each of the LE records is cross-correlated with well known catalogues of
astronomical objects and any coincidences are also written into the record. These
catalogues include the Bright Star catalogue, the IRAS catalogue, the revised
catalogue of Quasi Stellar Objects, plus several other listings of
extragalactic objects. It is also planned to include the catalogues available
at the Centre de Donnees Stellaire at the Observatoire de Strasbourg.
III. The Reduced Data Files
The reduced data files created by the automatic analysis are used to
produce the instrument summary files by operating on them with a standard set of
analysis routines e.g. source detection and spectral fitting programs. These
files are saved on an off-line medium (currently magnetic tapes, but eventually
optical disks) and include such things as background subtracted spectra, images,
lightcurves; etc. These files will be given in a format that will be compatible
with a suite of interactive programs to provide further analysis of these data.
These programs will include:
1. An image processing package to detect, or set upper limits to sources in the
field of view.
2. A spectral fitting program.
3. Fast Fourier transform, folding and general plotting facility (the latter may
be system dependent).
4. A program to convert the files to FITs format.
These programs and the data will be made available to be run on Vax systems.
IV. The LE Automatic Analysis
The revised LE automatic analysis software performs a detailed standard
processing of LE data, taking into account the final calibration of the
telescopes and detectors. For every observation a compressed image file is
created for each filter used. A compressed image is a file containing all the
information necessary to create a standard EXOSAT X-ray image and, because each
images is a sparse array, is written in way that enables a factor 10 saving in
disk space with respect to more common methods of storing images. The details of
how this is done are given elsewhere in this volume. Compressed images also allow
rapid transmission down data links. A program will be provided to convert these
images to FITs format after the image has been received. The images are searched
for sources and for every one detected its position, count rate, significance of
the detection and several other parameters of scientific interest are calculated
and written to the database. In addition for each source a file containing all
the relevant timing information is created and analysed by the timing analysis
software. The compressed images (for each filter used) and the time series files
for all detected sources plus the associated background. The main advantages of
the new LE automatic analysis are the following:
(i) Smaller uncertainties in source coordinates. The use of
new and improved star tracker calibration and of more precise misalignment values
allow 6 arc sec 90% confidence positions to be obtained in the center of the
field of view.
(ii) The broadening of the point spread function with increasing off-axis angles
is properly taken into account (see accompanying article in this volume).
(iii) Non-uniformities in the CMA background are included.
(iv) Many sources that in the old automatic analysis were missed because of their
proximity to other sources are now detected.
(v) A proper approximation to the boron point spread function is used.
V. The ME Automatic Analysis
The ME auto analysis output that observers received some ten weeks after their
EXOSAT observation was designed before launch and, although extensively modified,
could not be modified to incorporate the latest thinking on the background
subtraction, spectral fitting, timing analysis etc. In order to produce a
database of 'final products' such as spectra and lightcurves, the ME interactive
analysis software has been modified to run automatically.
The new ME automatic analysis system has been designed to produce, in an
automatic fashion, as many high quality spectra and lightcurves as possible. In
many cases the quality is such that users need not access the original FOT. These
files are operated on by a standard set of analysis programs and the results
written to the summary file.
Great care has been taken to design a system that can cope with the myriad of OBC
modes, observing configurations and types of source observed by the ME. One of
the most difficult areas of ME analysis is the choice of background subtraction
technique (discussed below). It is envisaged that a second pass through some
20-30% of the observations will be required to 'fix' problems due to poor
background subtraction. The automatic processing software has now been throughly
tested on many types of source and will, in principle, give results that are as
good as the ME interactive analysis e.g. QPO from GX5-1 were easily detected. The
limiting sensitivity for spectra is strongly dependent on the method of
background subtraction and the stability of the background. For many observations
the automatic analysis gives acceptable spectra for sources as faint as 1 UFU.
With similar constraints, the limiting sensitivity for detection is ~0.25
UFU.
(i) Description of the Processing
The new auto analysis utilises programs from the ME interactive analysis. This
has the advantage that the whole range of spectral, display and timing programs
developed for the interactive analysis can access the new auto analysis files.
The new auto analysis proceeds as follows:
1. Selection of the method of background subtraction.
2. Creation of spectral and rates files.
3. Spectral Analysis.
4. Timing Analysis.
5. Slew Analysis.
The selection of the most appropriate method of background subtraction for a
particular observation is an important step in obtaining the best possible
results. The software works in a hierarchical manner selecting, in order of merit,
the following background subtraction methods:
a. Array swaps if complete set of swaps present.
b. Array swaps if incomplete set present.
c. Slew background available.
d. No suitable background available.
Cases (a) and (b) will generally give the best results because background data is
obtained from the same detectors at a different time while they were pointing
away from the target. This introduces another uncertainty since offsetting the
detectors alters their background counting rate by a small amount - called the
difference spectra. For (a) the software generates its own set of difference
spectra using the + and - offset data (see EXOSAT Express No. 16, p.21). This
generally gives the best results. If an incomplete set of array swaps were not
obtained (case b) the program uses standard difference spectra. If no suitable
array swap data are available then background spectra obtained during the slew on
or off (or both) the source are used for background (case c). If no suitable slew
data are available then standard background spectra are used (case d). This
generally only gives satisfactory results for bright sources.
After selecting the method of subtraction the software creates a single spectrum
(integrated over the entire observation) and a number of rates (counts against
time) files. Rates files are created at the highest possible time resolution for
channels corresponding to energies of 1-3, 3-6 and 1-6 keV for the source and 1-6
keV for the background data. If the source intensity in >4 cts/s/4det then rates files of any available high
time resolution data will be produced. If the source count rate is >0.25
cts/sec/4det then an automatic spectral fitting procedure is run as described in
§VIII.
The next procedure is to run the timing analysis software described in §VII
to search for coherent periodicities, QPO, bursts and dips and to quantify the
amounts of variability observed on various timescales and energies.
Any slew data associated with the observation is processed to produce rates files
for the aligned and offset data as well as a file containing pointing positions
against time during each slew. If data is available with detector or quadrant ID
then rates files are produced separately for each offset quadrant since they
point in different directions.
(ii) The Instrument Summary Records
The summary records includes information from the spectral
and timing analyses as well as recording the way in which the analysis proceeded.
Each record contains count rates, the results of a periodicity search, pointing
position, observation class (HLX etc.), rms variability, best fit spectral
parameters etc. This makes for a very flexible way of searching for particular ME
observations of interest. For example, it is possible to select all HLX sources
that have best fitting power-law models or plot softness ratio against hardness
ratio for all AGN's etc. The summary record also contains information on the
location of associated hardcopies and archived reduced data files making it easy
to use the interactive analysis to further analyse the auto analysis results.
(iii) Limitations
Until a quality control check is made, for some of the observations the
background subtraction may not be as good as can be obtained by careful use of
the interactive analysis. In particular, for background selection cases (a) and
(b) the offset data is not screened for background variations. In background
selection case (c) the slew data is examined for the presence of point sources
only. Any long term variations in background counting rate will probably be
missed and produce an anomalous subtraction. Also, a slightly different type of
limitation is that only one spectrum is produced per observation. This means that
for burst sources, any bursts are included in the spectrum etc. It is anticipated
that up to 30% of the observations will require some sort of manual intervention
to correct problems. Checking the quality of the ME database will be a time
consuming and tedious task and it is anticipated that this will take at least
one year to complete after the automatic run has finished.
(iv) Reduced data files.
The following reduced data files will be archived:
1. Time series files with the highest PHA time resolution available at energies
of 1-3, 3-6 and 1-6 keV.
2. Time series files for 1-6 keV with a time resolution of 30 sec for both source
and background.
3. Image files from the FFT analysis.
4. Slew time series files
5. The history of the spacecraft pointing during slews.
6. Spectra from the offset quadrants if there is evidence for background
contamination.
7. Spectra for each observation plus a summary file with results from the
automatic spectral analysis
Only 2, 4 and 7 will be kept permanently available. The others are either too
large or not of sufficient interest to keep on disk, but they can be be restored
on request.
VI. The GSPC Automatic analysis
This will primarily consist of a background subtracted
spectrum for each observation where the ME count rate was greater than 5
ct/s/half. For weaker sources the signal to noise is not sufficiently high to
justify analysis.
The analysis creates a rates file for both the slew and the source in the energy
ranges 2-7 keV and 8-15 keV. Any sources in the slew are removed and the average
count rate used to re-normalize the standard background. This standard background
is then subtracted from the source spectrum and the resulting spectrum analysed
in the same way as the ME spectra. The structure of the GSPC database is similar
to that from the ME with for each observation one record written with interesting
parameters such as count rates, the results of the spectral fitting etc. The
spectral and time series files are archived on magnetic tape.
VII. The Timing Analysis
The files containing the source and background light curves for the ME and the LE
are processed by a timing analysis system and part of the results stored into the
database summary file for the relevant instrument. Many tasks of the timing
analysis are common to both instruments. These are:
1. Test source and background constancy.The variance of the light
curve is compared to that expected from a constant source (when instrumental and
computer dead time effects are taken into account). The results are evaluated in
terms of the rms variability of the source (or the background). The advantage of
the rms variability is that its value depends only on the source (or background)
variability properties over the range of timescales explored, while is
independent of the effective area of the instruments, source count rate etc. If
the source (or the background) is consistent with being constant a 90%
confidence upper limit to the rms variability is calculated.
2. Search for bursts and dips. This search is carried out both to
detect bursts and dips from the source and to reveal background activity or on
board computer problems. Bursts and dips are defined by a departure larger than 5
times the standard deviation of the light curve points. A maximum number of 48
bursts and dips is allowed for each light curve analysed. The time of occurrence,
duration and maximum or minimum count rate is calculated for each burst or
dip.
3. Power spectrum analysis.
The power spectrum is computed for each lightcurve using an FFT to search for coherent periodicities,
quasi-periodic oscillations and other features in the source variability (e.g.
red noise, shot noise etc.). In the cases in which the light curve consists of
more than one interval, the power spectra from individual intervals are summed.
The results are presented in graphic form and the maximum value of the power (and
the corresponding frequency) is output over two different ranges of
frequencies (0.0 - 0.1 and 0.1 - 1.0 times the Nyquist frequency).
For all ME observations the analysis first uses the original binning time of the
light Curves (usually 10s) and then is repeated for a binning time ten times
longer. For the sources > 4 ct/s/half the high time resolution ME data (with
binning times of a few milliseconds or less) are analysed by a dedicated timing
analysis program which computes the source power spectrum up to very high frequencies, for each 4096 data points.
The power spectra obtained are then summed to give an average power spectrum
which is then searched for coherent and quasi periodic oscillations and displayed
as in (c). In addition the program produces a "Time Image File" which is used to
display the source light curve together with a colour-coded representation of
each 4096 points power spectrum. This type of power spectrum display has proven
very useful in searches and studies of fast (1-50 Hz) quasi-periodic oscillations
in the X- ray flux bright galactic X-ray sources.
For the LE the time resolution is optimized for each observation such that the
average number of counts per bin is ~0.3. Again the analysis is repeated using a
binning time that is ten times larger.
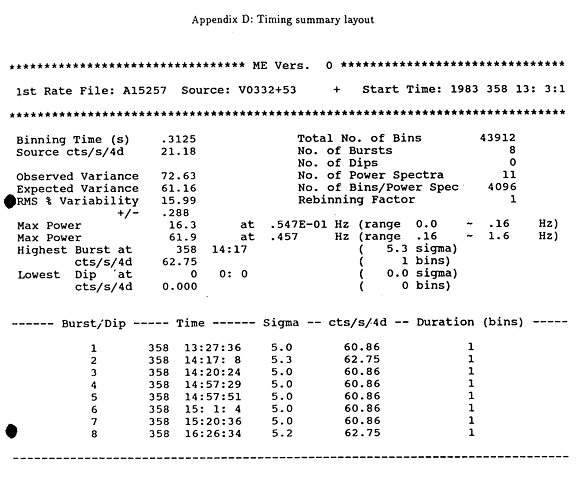
The results from each run are stored in Timing Summary Files which
are archived. An example of the contents of one of these files is given in
Appendix D. The most important results are also put into the data base summary
files.
VIII. Spectra
The automatic spectral analysis program fits a variety of standard spectral
models to the ME and GSPC spectra generated by the automatic analysis. The
following models are fit to the data and the best fitting parameters and
stored for each model : thermal, powerlaw, blackbody and Compton. If an
acceptable is not obtained then the same models are fitted with the addition of an iron
line. If this also fails to give a satisfactory fit then multi- component models
are also tried: a power law with a high energy cut-off, Compton plus blackbody
and Compton plus a powerlaw tail. Such automated fitting programs are far from
infallible and in many cases an inappropriate model will give the best fit. During
the quality control check these faults will be corrected by reading into the
database a fit made using an interactive fitting program.
In addition to this it is recognized that many spectra will be generated
by users of the interactive system. Many of these will have been processed with
extreme care to obtain the best possible background subtraction. These spectra
will be stored into an ME spectral file and will also be available.
A flag will be put into the ME summary file to alert users that a better spectrum
exists. This will for example allow for a canonical EXOSAT spectrum of such
objects as Cas A or Perseus cluster to be simply obtained by an outside user. It
will be possible to generate and extract via remote file transfer the appropriate
detector response. The spectra obtained from the objective grating spectrometer
will also be available in a similar manner.
IX. Slew Survey
When EXOSAT was slewing across the sky between its scheduled targets the ME
detectors were, for most of the mission, left on. The principal intention of this
was to monitor the particle background but it also gave a useful all- sky survey.
Part of the routine analysis of EXOSAT ME data is a search for sources using
10-second integrations of channels 6-30 (1-7 keV). Channels 40-60 are used to
monitor the particle background. It is expected that several hundred sources both previously catalogued and new
will be found with a sensitivity limit of a few millicrabs. The position of a
source can be determined to an accuracy of at best a few tens of arc seconds
along the direction of the slew. In the perpendicular direction it is the width
of the collimator (45 arc min FWHM) which defines the error region.
The DMS will allow for the input of an RA and Dec on the sky and will return the
number of times EXOSAT slewed over that area of sky and the closest detected
source. This will form the basis for a catalogue of new EXOSAT sources, as well
as detections of previously known ones.
X. Remote Access
The DMS will reside on both the observatory micro-vax (known as Vivean) and the
HP1000 computers. These will be available for use by the community at ESTEC. The
five summary files and the DMS will be kept on line. Because of disk space
limitations it is not currently possible to keep all the reduced data files
permanently available on disk for instant access. With the advent of optical
disks this may become possible in future.
The micro-vax can be accessed via SPAN and this will form the main route for the
community to interact with the DMS. A separate article in this volume describes
the procedure for remote logon. Because of the differences in network protocols
not all members of the community have the same capabilities, e.g. IBM
machines will only be able to transfer files back and forth to Vivean
(mail access), while VAXes and most other small systems may have the capability
for remote interactive access, depending on their network links. In the oncoming
years it is expected that the richness of these links will increase greatly so
that almost anyone on an academic VAX in Europe, North America or elsewhere
should have interactive access. Those users could, in principle, be allowed
access equivalent to members of the Observatory on site, although graphics will
be slow (image displays in particular would take a long time) unless a high speed
link is available.
Access to Vivean will occur on four levels as follows:
(i) Mail access - The request account.
A special account (EXOSAT::REQUEST) has been setup that acts as a general
mailbox. This account is checked dally to process incoming mail and would be
similar to the Observatory BITNET account on Profs (MAILEX@HNOESA10). The
following items would be handled by this account:
1. Requests for information or archive requests.
2. Requests for restoration of reduced data files.
3. Batch processing requests. This would allow mail-only users to submit jobs to
access the DMS. The output would then be returned by computer mail (or normal
mail).
(ii) Direct Access
Any user on another SPAN node (which essentially means WORLD
access) may access the DMS and any activity allowed to DECNET can be performed.
The prime purpose of this is to allow free use of the DMS to interrogate the
summary records. In this way astronomers will be able to obtain a concise summary
of each observation as well as being able to manipulate the various
parameters.
(iii) Visitor accounts
In those cases where a more detailed analysis is required it will be possible to
grant individual user IDs to observers, as occurs when observers physically visit
the observatory. Then the full interactive facility available on Vivean could be
used to further analyse the reduced data files. This will include a more detailed
spectral analysis and specialized timing and plotting programs. Because some of
the reduced data files will not be permanently mounted this will require at least
one days notice for the relevant files to be restored. Eventually it is
envisioned that the most frequently used reduced data files will be written to
permanently mounted optical disks.
(iv) File Transfer
Users with SPAN access will also be allowed to transfer to their local computer
some of the information in the database. This will include images, lightcurves,
spectral buffers (and the associated detector response matrix) plus other
assorted useful items. In this way it will be possible to fit more complex models
to the data that may not be available on Vivean, or directly compare the
EXOSAT data with those from other observatories. Also the executables of the
interactive software required to operate on these files will also be made
available for use on other Vaxes. The transfer out of data for extended analysis
will be encouraged since the capacity of the micro-vax is limited.
XI. Timeline
The implementation of this plan is now well underway. Below are given
some key dates for both past and future activity along with the personnel responsible for
the various activities outlined.
October 1986 ME autoanalysis reprocessing begins:


*            Overall system  A.N. Parmar


*            Timing analysis L. Stella


*            Spectral analysis - N.E. White


*            lightcurves - J. Osborne


May 1987     GS autoanalysis reprocessing begins:

*             Overall system - M. Gottwald


June 1987    Slew analysis begins:


*            - A. Pollock


*            - A. Parmar


Sept 1987    LE autoanalysis reprocessing begins:


*            Overall system P. Giommi


*            Lightcurves  J. Osborne


*            Compressed images - J. Sternberg


*            Timing analysis - L. Stella


*            PSF - L. Angelini


Dec 1987 Complete transfer of database to microvax:


*            - M. van der Klis


*            - P. Giommi


*            - L. Osborne


Jan 1988 Begin quality control for ME:


*            - A.N.Parmar + other

               team specialists


July 1988      Complete Grating spectra database:


*              Overall system - J. Osborne


               Calibrations - H. van der Woerd


July 1988      Complete computerized EXOSAT bibliography

*              - P. Barr

*              - G. Giommi


- Dec 1988     Complete software for accessing reduced data files.

*              - A. Pollock

*              - A. Parmar


- Summer 1988  Complete LE and GS reprocessing, begin quality control.


- December 1988  Bring database online to community.


- December 1989  Finish quality control based, in part, on community inputs


- December 1989  Put database on optical disks.
[EXOSAT Home]
[About EXOSAT]
[Archive]
[Software]
[Gallery]
[Publications]