| About ROSAT |
ROSAT Home Page | ROSAT Images |
|---|
The HRI in-orbit background is composed of several components:
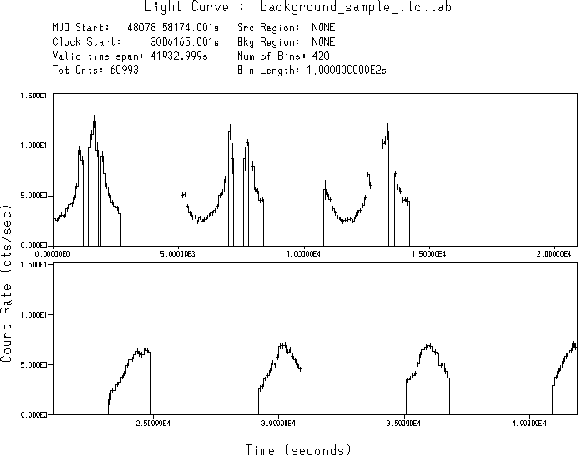
Figure 5.14 shows the variation in the background rate during an HRI observation of the North Ecliptic Pole (NEP). The lowest rates occur when the satellite is crossing the equator and the highest rates occur at the northern and southern extremities of the orbit. In many cases the HRI high voltage needs to be reduced in these regions to protect the detector from overload. Table 5.6 summarizes the average in-orbit values (and ranges) of all the background components.

Figure 5.14: The background rate over the entire HRI field in a portion
of the 40 ksec observation of the NEP

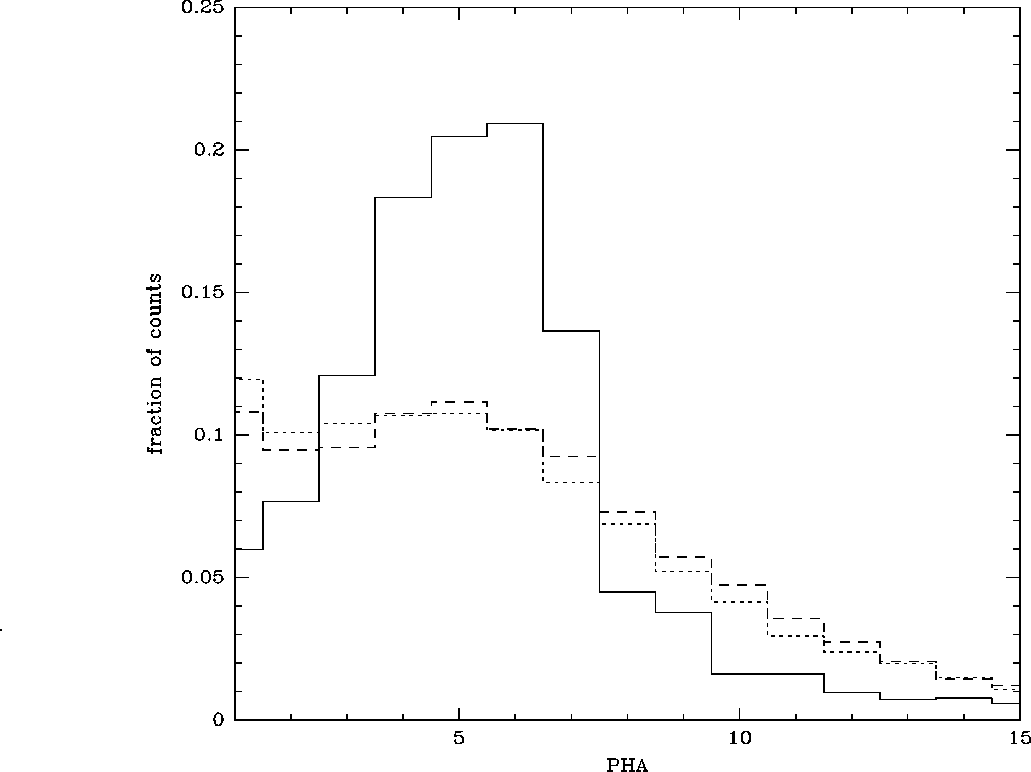
Figure 5.15: The PHA distribution of the HRI background during high
background intervals (dashed curve), low background
intervals (dotted curve), and AR Lac (solid curve)
Figure 5.15
compares the pulse height analyzer (PHA) distribution of the
background in the NEP observation during low background intervals
(count rate <5.0 counts s ![]() ;
dominated by detector noise and the XRB) and high background
intervals (count rate >5.0 counts s
;
dominated by detector noise and the XRB) and high background
intervals (count rate >5.0 counts s ![]() ;
dominated by externally induced background events).
Even though the background is dominated by different particles
during these intervals, the spectra are consistent given the
very modest energy resolution of the HRI.
The background rate is the greatest in the lowest PHA channels
since radioactive decay in the MCP glass and charged particles
can produce electrons anywhere within the MCPs.
These electrons are accelerated through a smaller potential
difference than electrons produced near the entrance of the MCPs.
The background in PHA channels <10 is very uniform
across the detector.
The background in PHA channels >10 is enhanced beyond 15'
off-axis due to the greater gain in the detector (see
;
dominated by externally induced background events).
Even though the background is dominated by different particles
during these intervals, the spectra are consistent given the
very modest energy resolution of the HRI.
The background rate is the greatest in the lowest PHA channels
since radioactive decay in the MCP glass and charged particles
can produce electrons anywhere within the MCPs.
These electrons are accelerated through a smaller potential
difference than electrons produced near the entrance of the MCPs.
The background in PHA channels <10 is very uniform
across the detector.
The background in PHA channels >10 is enhanced beyond 15'
off-axis due to the greater gain in the detector (see ![]() ).
).
Also shown in Fig. 5.15 is the PHA distribution in an HRI observation of AR Lac. Notice that the AR Lac spectrum is much more strongly peaked than the background spectrum. Most of the AR Lac source photons fall between PHA channels 3 and 7. In general, to obtain maximum sensitivity for detecting point sources or for analyzing low-surface brightness extended objects, the user is advised to screen out the highest background intervals and only examine PHA channels between approximately 3 and 8, inclusive. The optimum range of PHA channels depends on the source, the source position on the detector, and the date of observation. The user is advised to compare the source and background spectra for each observation to determine which channels should be screened out.