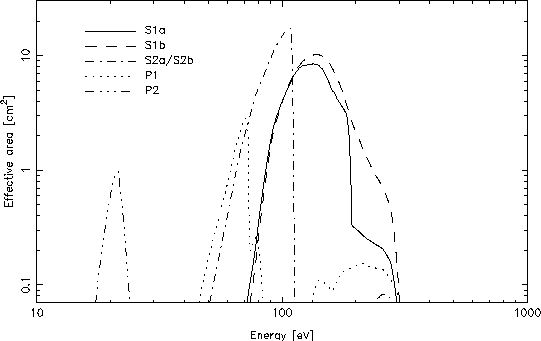
Figure 6.3: The effective area of the WFC for the six science filters (at the time of launch).
| About ROSAT |
ROSAT Home Page | ROSAT Images |
|---|

Figure 6.3: The effective area of the WFC for the six science filters
(at the time of launch).
Figure 6.3 shows the on-axis effective area of the complete WFC for each filter at the time of launch. These curves have been derived from calibration data acquired both on the ground and in-orbit. The systematic uncertainties are probably of order 10% for the S1 and S2 filters and 30% for the P1 and P2. Note that some of the available WFC filters have a secondary transmission band in the far-ultraviolet. Although the far-UV transmission is much weaker than that in the primary EUV bands, problems may potentially arise when observing objects that have a particularly strong far-UV component in their spectrum.

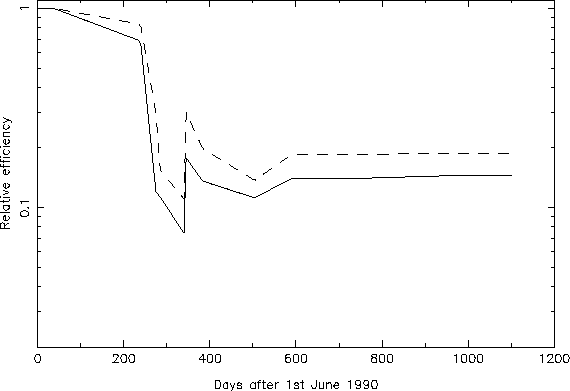
Figure 6.4: The long-term efficiency history of the WFC in the S1
(solid line) and S2 (dashed line) filters.
The P1 and P2 filters follow the same trend as the S1 filter.
During a period of attitude control failure and uncontrolled pointing on 1991 January 25-26 the ROSAT WFC suffered a severe loss in sensitivity. This is thought to be due to contamination of the detector photocathodes, although the source of the contamination is not known. For some time after this event the efficiency of the instrument continued to drop reaching a minimum around June 1991. It then started to improve slowly but reached a plateau in July 1992 and now seems to have stabilised. Efficiency history curves have been constructed for all the WFC filters from periodic calibration observations of DA white dwarfs; these curves can be used to compare WFC observations at different epochs (Fig. 6.4).

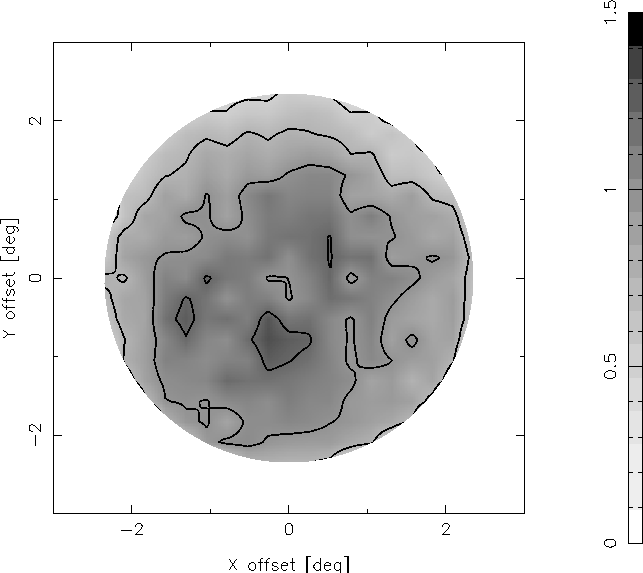
Figure 6.5: The spatial variation in WFC sensitivity, produced from the
survey observations of the bright white dwarf HZ 43.
The sensitivity variations are a combination of the mirror
vignetting and the spatial variations in the MCP detector
quantum efficiency. Note that the WFC sensitivity peaks off-axis.