In December of 1995 the source GRO J1744-28 was discovered by CGRO as it went into outburst. Several weeks later RXTE was launched and 19 days after the launch the source had moved to more than 30 degrees away from the Sun so the RXTE could begin observing it. The source proved to be interesting for a variety of reasons, and in fact is unique in the galaxy. Therefore it is commonly referred to as "the Bursting Pulsar". The X-rays observed by RXTE come from accretion onto a pulsar with a spin period of 0.467 s which lies in a binary star system with an orbital period of 11.8 days. The most noticeable attribute of the system was the large outbursts which were seen for 5 months in early 1996, and for several months in 1997. RXTE observed the source repeatedly during this time. The observations were declared "public", thus anyone can access them through the RXTE archive. There is not currently a complete understanding of all the variability that is seen in the Bursting Pulsar. For instance, the 40 Hz QPO that were seen were originally thought to be due to a beating effect between the pulsar and accretion disk, but the fact that this frequency did not vary with the persistent flux argues against this interpretation. The giant outbursts are thought to be due to a limit cycle instability operating in the inner edge of the accretion disk, whereby material piles up until the pressure due to the radiation field within the gas becomes comparable to the gas pressure. When this happens, the matter in the inner disk accretes rapidly onto the pulsar, producing a brief burst of X-rays.
Figure 1: RXTE light curve of GRO J1744-28 (2-10 keV) from 1996 March 13.
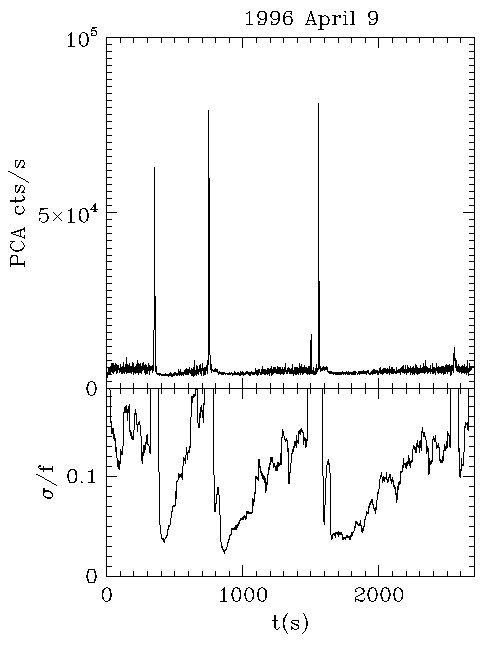
Figure 2: RXTE light curve of GRO J1744-28 (2-10 keV) from 1996 April 9.
The increase in the level of fluctuations between major outbursts agrees with theoretical calculations which predict more ``noise'' in the accretion disk as the critical condition for outburst is approached (see J. K. Cannizzo, ApJ, 482, 178, 1997 June 10 ). In fact, during the period of renewed activity which occurred in the summer of 1996, there was no clear dividing line between fluctuations and bursts: one saw variability on a continuum of time scales. Figure, Caption and supporting text provided by J. Cannizzo Back to Snazzy Science from RXTE If you have a question about RXTE, please send email to one of our help desks.
|


