Filenames and Contents
Each source may have up to three Mission-Long Data Products:
-
Mission-Long FITS file (Source_ID.fits)
-
PCA and HEXTE light curves (Source_ID_rates.gif)
-
PCA hardness ratios (Source_ID_hardness.gif)
where "Source_ID" is the unique source identifier, based on the SIMBAD-
recognized source name. Sources which have less than 30 good
observations will only have a Mission-Long FITS file. (See
Introduction: Which Sources, Which Data? for a
description of "good" observations.)
- Mission-Long FITS file (Source_ID.fits)
This file contains the data plotted in the two GIF products. Each
row in the file is a separate RXTE observation (obsid), drawn from
all proposals that included the source as a target. It is possible
for a point to not appear in the corresponding plot (such as when
the Std1 rate is less than zero) but the data from this obsid still
appears in the FITS file. For each observation, the data table lists
the obsid, the RA and Dec, the start time, stop time, and mid-time,
expressed in RXTE Mission Days (following the precedent of RXTE ASM
FITS files). The table also contains all Std1, Std2 and HEXTE rates
and errors, with the PCA data normalized to 1 PCU (ie., rates are in
units of c/s/PCU). The "exposure" column shows the total goodtime
used for each observation. (Goodtime was determined by
RXTE Standard
Products filtering criteria.)
The number of PCUs whose data went into the calculations of the PCA
rate is stored in the NPCU column. There are also columns which report
whether the rate for the observation appears in the PCA or HEXTE plots.
- PCA and HEXTE light curves (Source_ID_rates.gif)
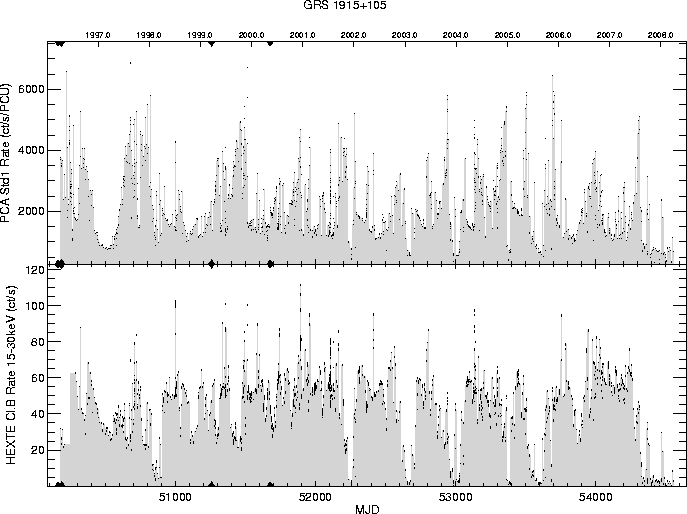
Combined plot of the average, background-subtracted PCA Std1 Rate in ct/s/PCU (top)
and the average HEXTE Cluster B rate in the 15-30 keV band in ct/s(bottom).
Time, plotted on the x-axis, is shown in MJD at the bottom, and by calendar year
at the top. The area under the plotted data points is shaded
grey, to make the sequence of points easier to discern. Instead
of drawing a diagonal line to connect two widely separated points, a pair
of horizontal lines are used that meet at the half-way point between
the plotted data. Please note that this is not an interpolation,
and no meaning for the data value should be inferred. For many sources,
the mission-long light curves span several PCA gain epoch boundaries.
Black diamond symbols on the top and bottom x-axes indicate the dates
at which PCA gain transitions occurred. Gain transitions can introduce
sudden biases in count rates measured, or, more obviously, in hardness ratios,
since the energy-to-channel relation is affected.
- PCA hardness ratios (Source_ID_hardness.gif)
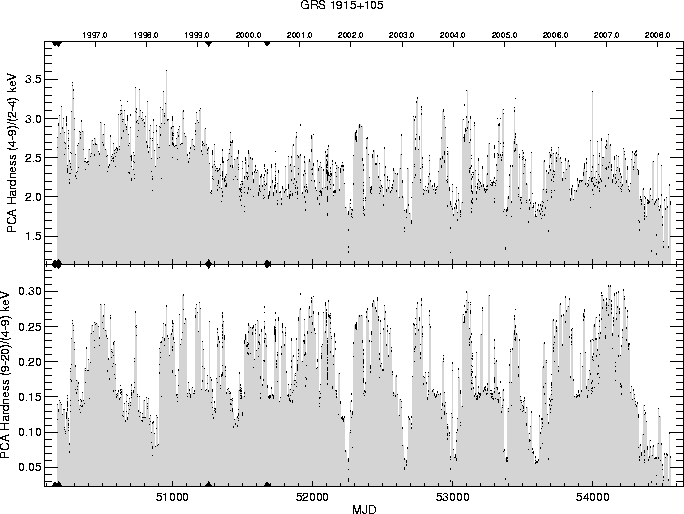
Combined plot of two hardness ratios from PCA Std2 rates. The ratio
of the rates in 4-9 keV/2-4 keV is displayed on the top panel, while
the ratio of 9-20 keV/4-9 keV is shown on the bottom panel. Again,
time is shown on the x-axis in MJD at the bottom, and by calendar
year at the top. The area under the plotted data points is shaded
grey, to make the sequence of points easier to discern. Instead
of drawing a diagonal line to connect two widely separated points, a pair
of horizontal lines are used that meet at the half-way point between
the plotted data. Please note that this is not an interpolation,
and no meaning for the data value should be inferred. As in the rates plot,
black diamond symbols on the top and bottom x-axes indicate the dates at
which PCA gain transitions occurred. Gain transitions can introduce sudden
biases in count rates measured, or, more obviously, in hardness ratios, since
the energy-to-channel relation is affected.
The GIF products for the microquasar GRS1915+105, which has been
monitored nearly continously during RXTE's mission, are shown
below.

Above: PCA and HEXTE rates from GRS1915+105. One point per observation. The
diamonds on the time axis represent gain epoch changes. See notes on
"PCA and HEXTE lightcurves," above, for further details.

Above: Hardness ratios of GRS1915+105 from Std2 rates in the 2-4, 4-9 and 9-20
keV bands. The diamonds on the time axis represent gain epoch changes. See notes on
"PCA hardness ratios," above, for further details.
Getting & Using Mission-Long Data Products
While the mission-long data products provide a broad overview to the
user of the contents of the RXTE archive for many sources, they should
not be considered as definitive products for generating publishable
scientific results. There may be some cases where useful science can
be performed using the mission-long data products alone, but generally
the purpose of these files and figures is to enable interested archival
investigators to get an accurate idea of the quality and extent of the
data, and of the source behavior, for objects of interest. Since the
mission-long data products contain a single point for each observation,
and are based on the standard products, which themselves are generated
using a general script and employ one single set of filtering criteria
for all observations, the results will not typically be optimized
to yield the most useful and reliable data in each individual case.
As always, when doing scientific investigations, there is no substitute
for performing the step-by-step analysis carefully for yourself.
The Mission-Long Data Products can be accessed in a variety of ways:
FTP/Web:
https://heasarc.gsfc.nasa.gov/FTP/xte/data/archive/MissionLongData/
BROWSE:
Select RXTE catalog "XTEMLCAT" to search the RXTE Mission-Long Data
Products source catalog in BROWSE.
The Fine Print: Details of Mission-Long Data Product Generation and Data Caveats
The same caveats that apply to the generation of
RXTE Standard Products
apply to the Mission-Long Data Products.
In addition, the following data caveats apply to the Mission-Long Data Products:
In some cases it may not be possible to filter out bad data perfectly.
The most common cause for this would be contamination by another source in
the field of view, although it is not always possible to identify a
cause without investigating in detail. Users should be aware of the
following potential data problems:
- 1E 1740.7-2942 - possible field of view contamination in some observations
- GALACTICCENTER - there are several objects in the field of view of this observation
- PSR B1509-58 - possible field of view contamination in some observations
- SMCPOSITION* - there are several objects in the fields of view of these monitoring
observations
Also, users should be aware that these products represent the PCA and
HEXTE count rates, not flux. As the calibrations of the instruments has
gradually changed throughout time, and suddenly when high voltage
changes have been commanded, the count rates may not be a completely
faithful representation of flux. Users can check the PCA rates and
hardness ratios of a canonical "constant" source such as the Crab to
demonstrate these effects.
If you have a question about RXTE, please send email to one of our
help desks.