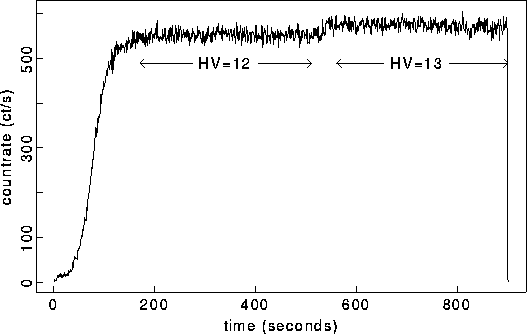
Figure 5.21: UV calibration observation taken during the HV change, showing a 4% increase in count rate. The marked regions are those used in the following figure.
| About ROSAT |
ROSAT Home Page | ROSAT Images |
|---|
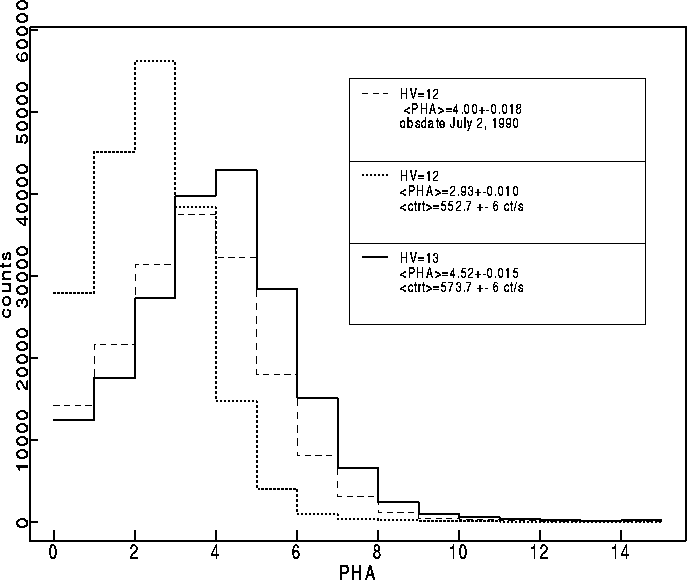
On 1994 June 21 at 8:59 GMT, the HRI high voltage was increased from level 12 to 13 in order to approximately recover the detector's original PHA distribution. Figure 5.21 shows an observation of the on-board UV calibration lamp taken during the HV increase. It exhibits an increase of 4% in the calibration lamp count rate, indicating the HV level change has approximately recovered the original UV sensitivity. In Fig. 5.22 the PHA distributions before and after the increase are compared with an observation taken shortly after launch, showing that the mean PHA has recovered to within 0.5 channels of the original. See also Tab. 5.4 and Fig. 5.19.

Figure 5.21: UV calibration observation taken during the HV change,
showing a 4% increase in count rate.
The marked regions are those used in the following figure.

Figure 5.22: Comparison of PHA distributions of UV calibration data taken
shortly after launch (dashed line) with data taken immediately
before and after the HV change, 1994 June 21.
(Counts are normalized to equal observation times.)