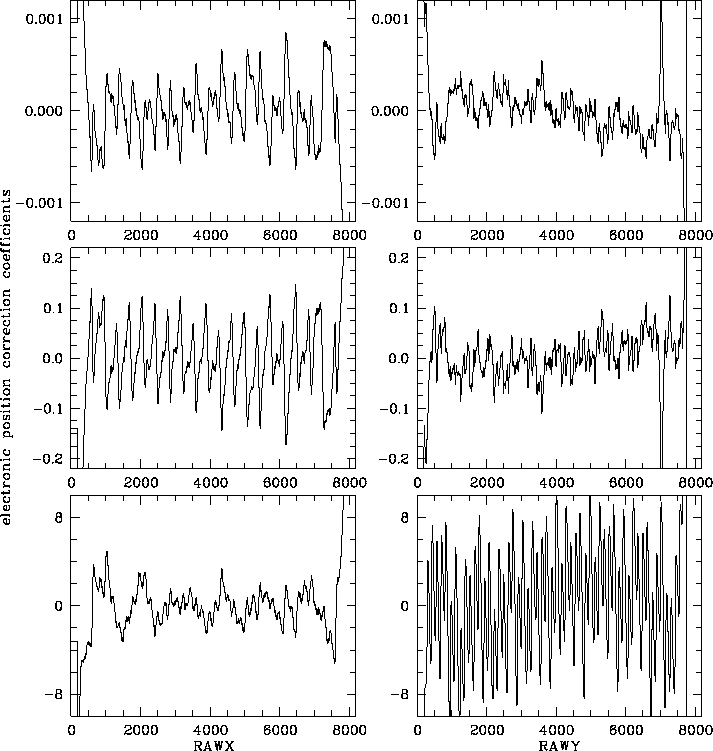
Figure F.6: Electronic position correction tables for PSPC-C: left from top to bottom
| About ROSAT |
ROSAT Home Page | ROSAT Images |
|---|

Figure F.6: Electronic position correction tables for PSPC-C:
left from top to bottom ![]() ,
,
![]() , and
, and ![]() , according to
Eq.(F.8);
right from top to bottom
, according to
Eq.(F.8);
right from top to bottom ![]() ,
,
![]() , and
, and ![]() , according to
Eq.(F.9).
The recorded raw detector coordinates
, according to
Eq.(F.9).
The recorded raw detector coordinates ![]() and
and ![]() correspond to RAWX and RAWY in the figure.
correspond to RAWX and RAWY in the figure.

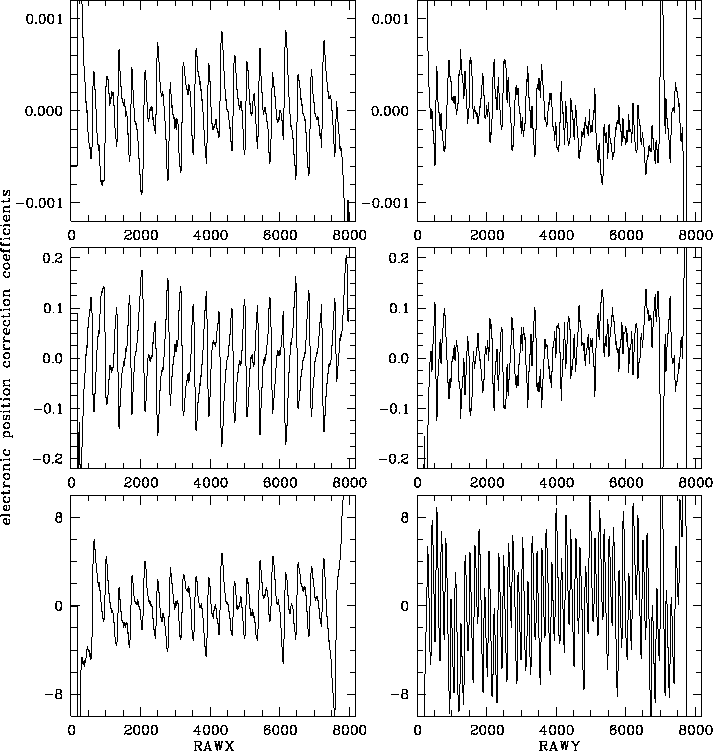
Figure F.7: Electronic position correction tables for PSPC-B:
left from top to bottom ![]() ,
,
![]() , and
, and ![]() , according to
Eq.(F.8);
right from top to bottom
, according to
Eq.(F.8);
right from top to bottom ![]() ,
,
![]() , and
, and ![]() , according to
Eq.(F.9).
The recorded raw detector coordinates
, according to
Eq.(F.9).
The recorded raw detector coordinates ![]() and
and ![]() correspond to
RAWX and RAWY in the figure.
correspond to
RAWX and RAWY in the figure.
The PSPC wires cause small-scale spatial non-linearities. This effect depends on the position as well as on the energy of the photon. A correction vector is computed using a parabola with spatially-dependent coefficients and the amplitude as variable according to Eq. (F.8) and (F.9).
Here ![]() ,
, ![]() , and
, and ![]() are the correction coefficients parallel
to the anode wire direction while
are the correction coefficients parallel
to the anode wire direction while ![]() ,
, ![]() , and
, and ![]() denote
coefficients perpendicular (``senkrecht'') to the anode wires.
The correction coefficients are stored in table with 4000 elements
and the electronic position correction is actually done by interpolation
between two table elements
(cf. Eq. (F.11)).
denote
coefficients perpendicular (``senkrecht'') to the anode wires.
The correction coefficients are stored in table with 4000 elements
and the electronic position correction is actually done by interpolation
between two table elements
(cf. Eq. (F.11)).
Figure F.6 and F.7 shows this correction for PSPC-C and PSPC-B, respectively.
There is an inconsistency in the documentation about the amplitude
to be used in the correction:
[Hasinger and
Snowden1990]
as well as
Chap. 3
and
[Turner et al.1995]
state ![]() , whereas
Chap. 8
(SASS) uses
, whereas
Chap. 8
(SASS) uses ![]() .
In fact, in the creation of the correction tables no corrections
had been applied, i.e.,
.
In fact, in the creation of the correction tables no corrections
had been applied, i.e., ![]() should be used; however, the differential
effect between
should be used; however, the differential
effect between ![]() and
and ![]() is minor
[Briel1995].
is minor
[Briel1995].
Parameters:
The electronic position correction in y is done similiar to the correction in x; simply replace x by y in the above formulae.
Remarks:
SASS source code: package PSPC, bubble CT, subroutine DCORE
SASS files: