| About ROSAT |
ROSAT Home Page | ROSAT Images |
|---|
The PSPC entrance window consists of a ![]() foil of
polypropylene (
foil of
polypropylene ( ![]() )
coated with
)
coated with ![]() gcm
gcm ![]() graphite
(for electrical conductivity to prevent charge buildup on the window
which would affect the electron drift velocity;
the graphite has impurities of
graphite
(for electrical conductivity to prevent charge buildup on the window
which would affect the electron drift velocity;
the graphite has impurities of ![]() 8% oxygen) and
8% oxygen) and
![]() gcm
gcm ![]() lexan (
lexan ( ![]() ,
to decrease UV transmission).
,
to decrease UV transmission).
The ground calibration results from measurements of the X-ray transmission of each of the four PSPCs is given in [Schmitt and Snowden1990]. Note, the only detectors actually flown were: PSPC-C (which was in use prior its destruction during the accidental ROSAT Sun-slew on 1991 January 25), and PSPC-B.
The available (PANTER) ground calibration measurements consist of window-average transmission values at 0.183, 0.277, 0.525, and 0.93 keV for each detector (corresponding to boron, carbon, oxygen, and copper fluorescent X-ray sources, respectively). In addition there are measurements of the total surface mass density, and that of polypropylene & lexan, and lexan only. The difficulties and analysis method used to disentangle the contributions from the various components (especially in view of the large carbon content in each) are described in detail in [Schmitt and Snowden1990].

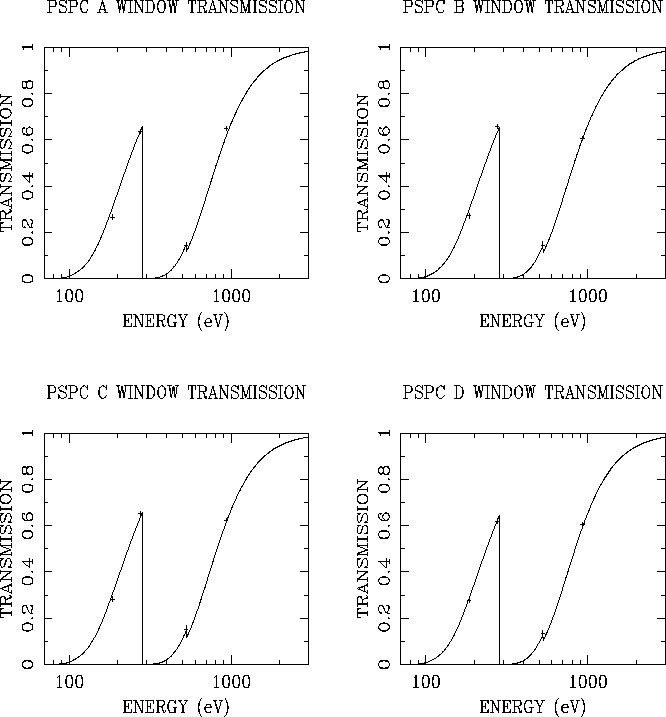
Figure 3.7: The ground calibration results for the transmission of each
ROSAT PSPC entrance window as a function of energy.
Note that the transmission here does not include the
average transmission of the window support mesh
[Schmitt and
Snowden1990].
In Fig. 3.7, the calculated best-fit transmission curves are shown for each window (assuming the atomic cross-sections of [Henke et al.1982]). along with the measured data points. From the results summarized in Tab. 3.1, it can be seen that the fits are formally acceptable for all but the window of PSPC-A. The bad fit for the PSPC-A window, the apparently systematically low 0.183 keV data (see Fig. 3.7), and the oxygen contamination of the graphite are all further discussed in [Schmitt and Snowden1990]. For convenience, the calculated transmissions at each energy for which there are PANTER data are listed in Tab. 3.2. It should be noted that these values do not include any corrections for shadowing by the window support grid or gas absorption-efficiency.
| PSPC | PPL | Lexan | Carbon | Oxygen | |
| | | | | ||
| A | 90.94 | 34.03 | 52.50 | 5.07 | 34.2 |
| B | 91.70 | 35.67 | 54.17 | 5.25 | 9.9 |
| C | 94.36 | 32.42 | 51.74 | 5.60 | 10.4 |
| D | 94.77 | 38.58 | 57.14 | 4.38 | 2.9 |
| Energy/keV | PSPC-A | PSPC-B | PSPC-C | PSPC-D |
| 0.183 | 0.300 | 0.290 | 0.296 | 0.278 |
| 0.277 | 0.642 | 0.636 | 0.640 | 0.624 |
| 0.525 | 0.143 | 0.137 | 0.141 | 0.124 |
| 0.930 | 0.613 | 0.606 | 0.611 | 0.594 |
| 1.487 | 0.878 | 0.875 | 0.877 | 0.870 |
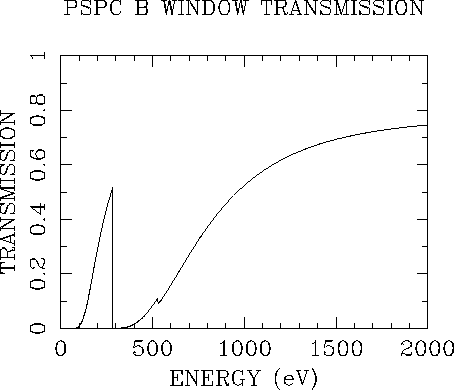
The modelled window transmission for PSPC-B (the window transmission for PSPC-C in nearly identical) is shown again in Fig. 3.8. It can be seen that the transmission is essentially zero at energies just above the carbon edge at 0.284keV, and approximately 50% at energies just below the edge.

Figure 3.8: The ROSAT PSPC-B entrance window transmission as a function
of energy. This detector was in use after the destruction
of PSPC-C during the ROSAT sun-pointing of 1991 January 25.