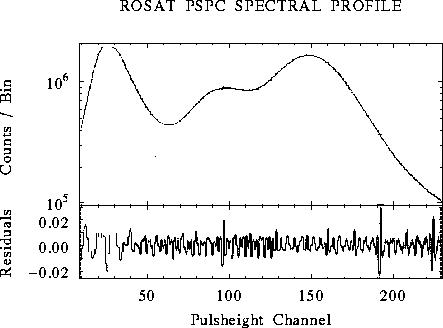
Figure 3.11: Upper panel: The cumulative spectrum from all PSPC ground calibration data (processed up to
| About ROSAT |
ROSAT Home Page | ROSAT Images |
|---|

Figure 3.11: Upper panel: The cumulative spectrum from all PSPC ground
calibration data (processed up to ![]() 1990 March 17)
fitting with a smooth spline function (upper panel) assuming
no ADC nonlinearities.
The corresponding residuals (lower panel) demonstrate
the ADC (pulse height) bins do not have equal widths though
on average they are linear to within
1990 March 17)
fitting with a smooth spline function (upper panel) assuming
no ADC nonlinearities.
The corresponding residuals (lower panel) demonstrate
the ADC (pulse height) bins do not have equal widths though
on average they are linear to within ![]() %.
The residuals are used to determine the true channel
boundaries, and thus enable individual events to be
corrected for the ADC nonlinearities
[Hasinger and
Snowden1990].
%.
The residuals are used to determine the true channel
boundaries, and thus enable individual events to be
corrected for the ADC nonlinearities
[Hasinger and
Snowden1990].

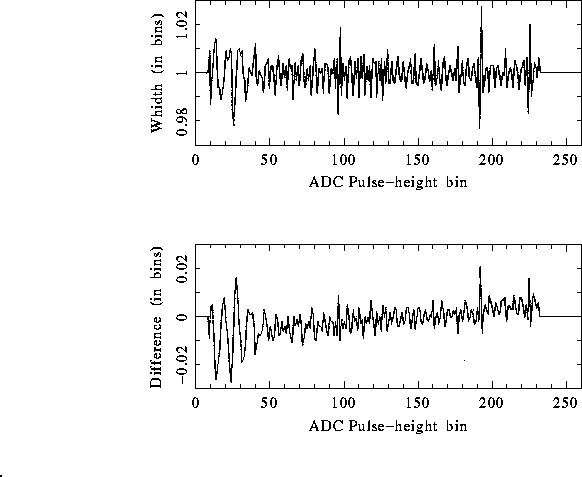
Figure 3.12: Upper panel: The width (in channels) of each ADC pulse height bin
(cf. the lower panel of Fig. 3.11).
Lower panel: The difference between the upper bound of each
pulse height channel assuming a linear ADC relationship and that
derived from the smooth spline fit to ground calibration data.
Both plots are derived from the data file
used by SASS5_0 to correct for the nonlinearities in the ADC
(cf. the lower panel of Fig. 3.11).
The analog-to-digital converter (ADC) shows nonlinearities in bin
width of <3% per channel (although on average they are linear).
The effective channel width has been calibrated by performing
a spline fit to a cumulative spectrum of all ground calibration data
accumulated by ![]() 1990 March (
1990 March ( ![]() events,
Fig. 3.11)
and subtracting a smooth spline function
(see Fig. 3.12).
The nonlinearity is corrected by drawing a random real number,
RAN (between 0 and 1.0), within the non-equidistant channel
events,
Fig. 3.11)
and subtracting a smooth spline function
(see Fig. 3.12).
The nonlinearity is corrected by drawing a random real number,
RAN (between 0 and 1.0), within the non-equidistant channel
where ![]() &
& ![]() are the measured (integer) & corrected
(real) pulse height bins,
and BE & BW arrays containing the (lower) edge and width
of the 256 non-equidistant channels respectively
(see also Chap. 8).
are the measured (integer) & corrected
(real) pulse height bins,
and BE & BW arrays containing the (lower) edge and width
of the 256 non-equidistant channels respectively
(see also Chap. 8).