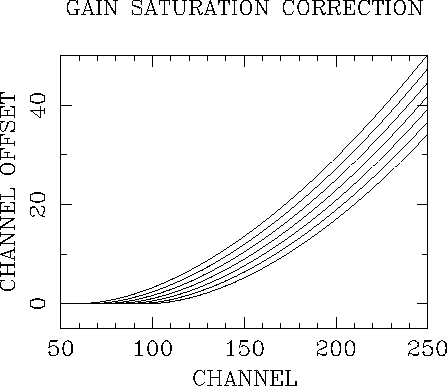
Figure 3.13: The difference between the true and measured pulse height channel due to gain saturation. The curves are for nominal gains of 90 (top), 100, 110, 120, 130, 140, and 150 (bottom) [Hasinger and Snowden1990].
| About ROSAT |
ROSAT Home Page | ROSAT Images |
|---|

Figure 3.13: The difference between the true and measured pulse height
channel due to gain saturation. The curves are for nominal
gains of 90 (top), 100, 110, 120, 130, 140, and 150 (bottom)
[Hasinger and
Snowden1990].
At large charge input, the PSPC shows some saturation of the gain
(i.e., a fall-off in the signal amplification).
This is a reasonably minor effect ( ![]() % below 1keV,
% below 1keV, ![]() %
at 2keV) and has been modelled using the spectral calibration data.
The gain saturation correction was determined using
the same data used to create the detector response matrix.
An analytic relationship was determined between
the mean of the fits to the calibration data and the true gain.
(Since the Al K
%
at 2keV) and has been modelled using the spectral calibration data.
The gain saturation correction was determined using
the same data used to create the detector response matrix.
An analytic relationship was determined between
the mean of the fits to the calibration data and the true gain.
(Since the Al K ![]() calibration line is at 1487eV,
it too is affected by the gain saturation.)
In the SASS processing, first the channel at which gain saturation
becomes significant is estimated based on the mean channel
of the Al K
calibration line is at 1487eV,
it too is affected by the gain saturation.)
In the SASS processing, first the channel at which gain saturation
becomes significant is estimated based on the mean channel
of the Al K ![]() line.
Then, the gain correction is calculated based on the empirical
relationship between gain and calibration line channel.
This gain correction is later used to make the temporal correction
for the entire PSPC channel range.
For details of the algorithm and SASS calibration files used see
Chap. 8.
The nominal gain is assumed to bring the Al K
line.
Then, the gain correction is calculated based on the empirical
relationship between gain and calibration line channel.
This gain correction is later used to make the temporal correction
for the entire PSPC channel range.
For details of the algorithm and SASS calibration files used see
Chap. 8.
The nominal gain is assumed to bring the Al K ![]() line into
channel
line into
channel ![]() .
The gain saturation correction is shown in
Fig. 3.13
for a range in nominal gains.
.
The gain saturation correction is shown in
Fig. 3.13
for a range in nominal gains.