

Next: Positional Response for Events
Up: Linearization of the Event
Previous: Small Scale Non-linearity (Electronic
[Hasinger and
Snowden1990]

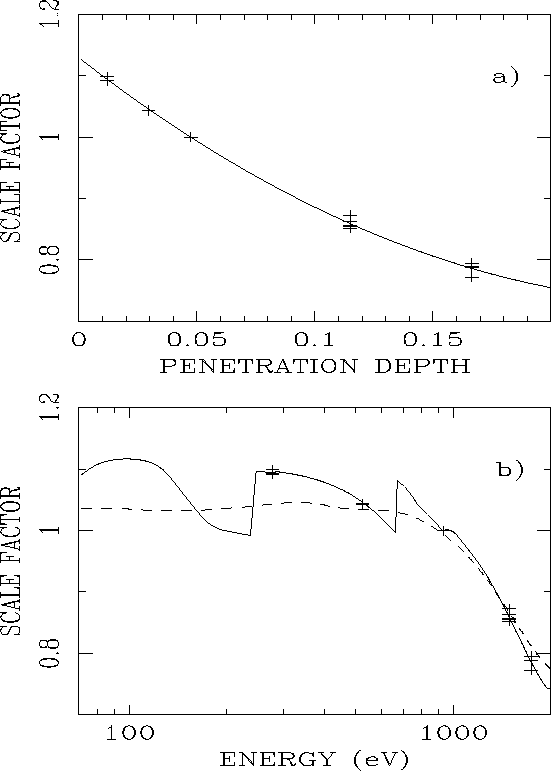
Figure 3.16: Scale factor of the ``Golden Disk'' as a function of penetration
depth (a) and energy (b).
The plus signs show the data of PSPC-A through
D, the solid curve is a parabolic fit to the data.
The dashed line in b) shows the curve weighted by effective area,
which is used by SASS\
[Hasinger and
Snowden1990].
The window correction removes the large-scale distortions
due to the bulging detector window.
The PSPC counter gas, at a pressure of 1.5 bar,
causes a bulging in the support grids between the aluminum
struts to a scale height of  mm.
Since the electric field lines run perpendicular to the
equipotential plane (the window), and since the primary
electron cloud drifts along these field lines,
the position of an X-ray event can be slightly shifted
towards the centre of the detector for events within
the central ring of the window-support structure.
For events outside of the central ring,
the direction of the shift is dependent on the event location.
This shifting of positions obviously introduces spatial nonlinearities.
The correction (termed ``golden disk'') is a function
of detector coordinates and energy.
The amplitude of the energy dependent term is assumed to be
a smooth function of penetration depth
(Fig. 3.16),
and is normalized to 1.0 at 0.93 keV (since the shape of the
``golden disk'' was determined from measurements at this energy).
For calibration file names and the equations for the
coordinate correction, see
Chap. 8.
If you have problems/suggestions please send mail to
rosat_svc@mpe-garching.mpg.de
