Copernicus Software
The FTOOLS provide a suite of programs that can be used to clean, merge, and background subtract a lightcurve. A method for extracting background-subtracted lightcurves from the 1-3 Å Copernicus data is described below.
There are two basic parameters used to clean the data: the high tension (set to 1 to represent detector on) and the observation constraints (set to 1 to represent no constraint). In the FITS file, the column name containing the observation constraints is OBS_CNSTR, and for the 1-3 Å data the high tension column name is HTF_1_3. However, it is good practice to always plot, using fplot , the values stored in the columns SEN_1_3, BKGMODE, LOWVLTFL, and ANTELGRP to insure that the settings of these parameters do not change during the observation. The definition of these parameters can be found within the header of each FITS file. In the simplest case, the basic cleaning of the merged file is obtained using the FTOOL fselect with the following expression: OBS_CNSTR == 1 && HTF_1_3 == 1Example : fselect Name of FITS file and [ext#][] copernicus.fits Name of output FITS file[] clean.fits Selection Expression[] OBS_CNSTR == 1 && HTF_1_3 == 1
fcalc
Name of FITS file and [ext#][]  clean.fits
Name of output FITS file[]  clean_bs.fits
Resultant column name[]  CNT_1_3SB
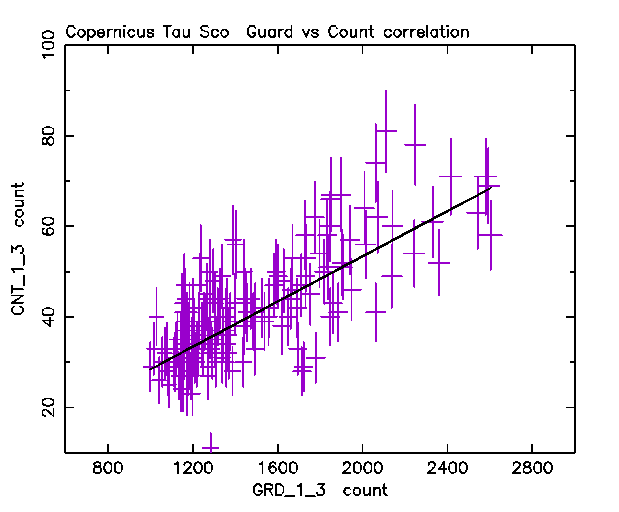
Arithmetic expression[]  CNT_1_3 - (3.4 + 0.025*GRD_1_3)
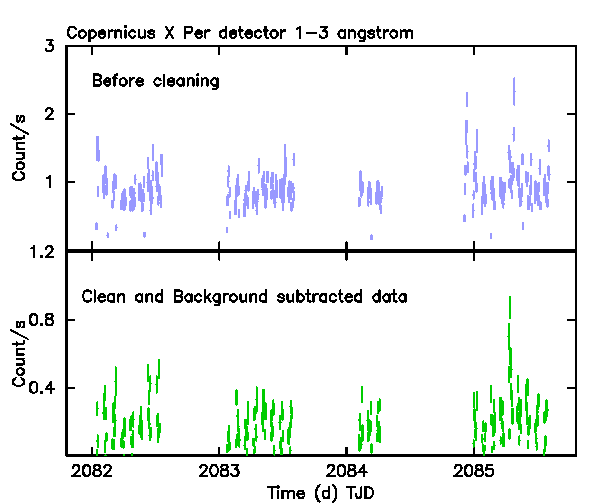
The figure below shows the results obtained applying this procedure to an observation of X Per. The original data are shown in the upper panel and the background-subtracted data in the lower. 
This background-subtracted lightcurve reproduces Fig. 1 of the White et al. 1976 MNRAS 176 201 paper, where the detection of the X Per periodicity was first reported.
Page authors: Lorella Angelini Jesse Allen HEASARC Home | Observatories | Archive | Calibration | Software | Tools | Students/Teachers/Public Last modified: Wednesday, 22-Apr-2020 10:41:24 EDT |


